

Financial Analysis of Himalayan Bank Limited
July 1, 2019 | Investopaper
The financial analysis of Himalayan Bank Limited as performed by Investopaper team is as follows:
Introduction of Himalayan Bank
Himalayan Bank Limited was established in 1993 in a joint venture with Habib Bank Limited of Pakistan. Few businessmen of Nepal and Employees Provident Fund collaborated with the Habib Bank to establish the bank. It is one of the leading commercial banks of Nepal. The Himalayan bank started the operation in January 1993.
The head office is located in Kamaladi, Kathmandu. Currently, the bank has a paid-up capital of Rs. 8.52 billion. The total deposits and loans of the bank are Rs. 108.58 billion and Rs. 93.78 billion.
You May Also Like: Financial Analysis of Commercial Banks of Nepal
Board of directors and the Management team of Himalayan Bank
Mr. Manoj B. Shrestha is the current chairman of the bank. The board members of Himalayan Bank include:
| S.N | Board Members | Post |
| 1 | Mr. Manoj B. Shrestha | Chairman |
| 2 | Mr. Faisal N. Lalani | Director |
| 3 | Mr. Prachanda B. Shrestha | Director |
| 4 | Mr. Tulasi Prasad Gautam | Director |
| 5 | Mr. Sushil Bikram Thapa | Director |
| 6 | Mr. Bijay Bahadur Shrestha | Director |
| 7 | Mr. Radha Krishna Pote | Independent Director |
| 8 | Mrs. Ranjana Shrestha | Alternate Director |
| 9 | Ms. Menuka Shrestha | Alternate Director |
| 10 | Mr. Sunil Bahadur Thapa | Alternate Director |
| 11 | Mr. Damodar Prasad Subedi | Alternate Director |
| 12 | Mr. Himalaya S. Rana | Chief Advisor to the Board |
| 13 | Mr. Bipin Hada | Company Secretary |
The management team of Himalayan Bank is led by Mr. Ashok SJB Rana. The team members include:
| S.N | Management Team | Post |
| 1 | Mr. Ashoke SJB Rana | Chief Executive Officer |
| 2 | Mr. Sushil Joshi | General Manager |
| 3 | Mr. Ujjal Rajbhandary | General Manager |
| 4 | Mr. Anup Maskay | General Manager |
| 5 | Mr. Rabindra Narayan Pradhan | Assistant General Manager |
| 6 | Mr. Maheshwar P. Joshi | Assistant General Manager |
| 7 | Mr. Bipin Hada | Assistant General Manager/Company Secretary |
Shareholding Structure of Himalayan Bank
Himalayan Bank was established through the foreign joint venture with Habib Bank of Pakistan. So, Habib Bank Limited holds a 20 percent share in the bank. The remaining 80 percent is possessed by Nepalese institutions and the public. Out of 80 percent of domestic ownership, institutions hold a 65 percent share of the company. Likewise, the general public has a 15 percent share in the bank.
| Ownership Structure | Percentage (%) |
| Domestic Ownership | 80 |
| Institutions | 65 |
| General Public | 15 |
| Foreign Ownership | 20 |
| Total | 100 |
Financial Analysis of Himalayan Bank Limited: Last 5 Years
Paid-up Capital, Shareholders’ Fund and Total Assets
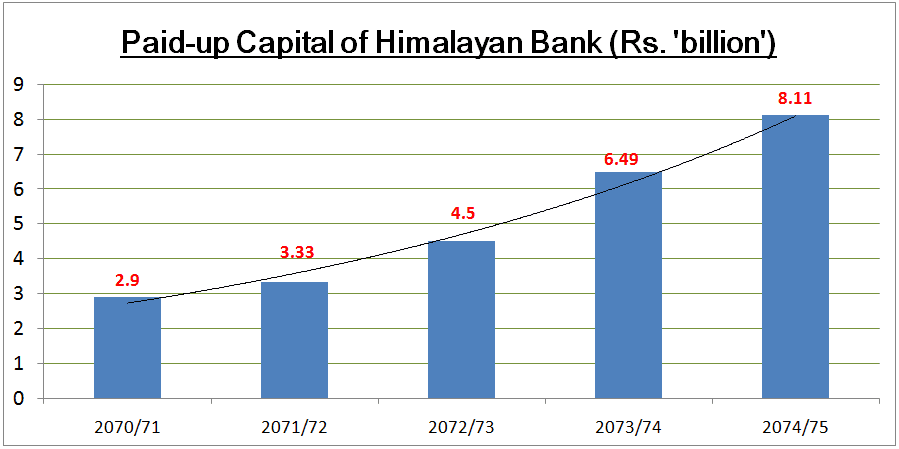
In the past five years period, the capital, shareholders’ fund, and the total assets have grown significantly. The paid-up capital of the bank has increased by almost 3 fold. In the fiscal year 2070/71, the paid-up capital stood at Rs. 2.90 billion. The capital has gradually inclined and stood at Rs. 8.11 billion at the end of fiscal year 2074/75. In the third quarter of the current fiscal year 2075/76, the capital stands at Rs. 8.52 billion.
Likewise, the shareholders’ fund of the Himalayan Bank has also expanded by two and a half times during this period. The shareholders’ fund stood at Rs. 6.08 billion in fiscal year 2070/71. It has grown to Rs. 14.14 billion at the end of the fiscal year 2074/75. As of the third quarter this year, the shareholders’ fund stands at Rs. 15.26 billion.
Similarly, the total assets of the Himalayan Bank have grown to Rs. 118.39 billion at the end of the fiscal year 2074/75. The total assets stood at Rs. 74.72 billion in fiscal year 2070/71. This is a rise of 58 percent in a period of 4 years. With the rise in capital, deposits, and loans, the total assets have increased gradually. Until the third quarter of this year, the total assets stand at Rs. 132.46 billion.
The paid-up capital, shareholders’ fund and total assets of the Himalayan bank in the last five years are shown in the table below:
| Fiscal Year | Paid-up Capital (Rs. ‘billion’) | Shareholders’ Fund (Rs. ‘billion’) | Total Assets (Rs. ‘billion’) |
| 2070/71 | 2.9 | 6.08 | 74.72 |
| 2071/72 | 3.33 | 6.96 | 84.75 |
| 2072/73 | 4.5 | 8.82 | 101.22 |
| 2073/74 | 6.49 | 11.71 | 108.5 |
| 2074/75 | 8.11 | 14.14 | 118.39 |
Paid-up capital of Himalayan Bank in the last five years: In the chart
Deposits and Loans & Advances of Himalayan Bank
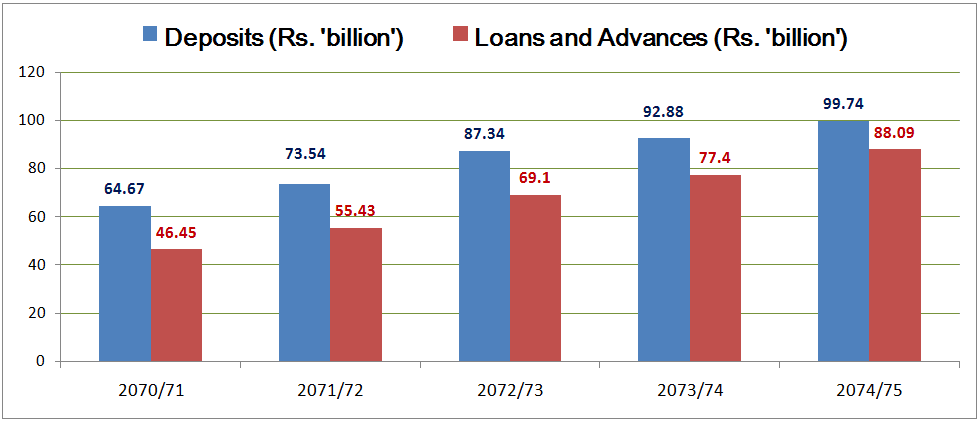
Himalayan Bank is one of the top banks in terms of deposit collection and loan portfolio. The bank has a deposit of Rs. 108.58 billion until the third quarter of this fiscal year 2075/76. Likewise, the total loans and advances are at Rs. 98.99 billion. The total deposits stood at Rs. 64.67 billion in the fiscal year 2070/71. This has grown to Rs. 99.74 billion at the end of F.Y. 2074/75.
Likewise, loans and advances have more than doubled in a period of five years. Himalayan Bank had floated loans of Rs. 46.45 billion until the fiscal year 2070/71. The loans and advances have grown to Rs. 88.09 billion at the end of 2074/75 and Rs. 98.99 billion until the third quarter of fiscal year 2075/76.
The deposits and loans of the Himalayan bank in the last five years period are shown in the table below:
| Fiscal Year | Deposits (Rs. ‘billion’) | Loans and Advances (Rs. ‘billion’) |
| 2070/71 | 64.67 | 46.45 |
| 2071/72 | 73.54 | 55.43 |
| 2072/73 | 87.34 | 69.1 |
| 2073/74 | 92.88 | 77.4 |
| 2074/75 | 99.74 | 88.09 |
Deposits and loans of Himalayan Bank in the last five years: In the chart
Net Profit of Himalayan Bank
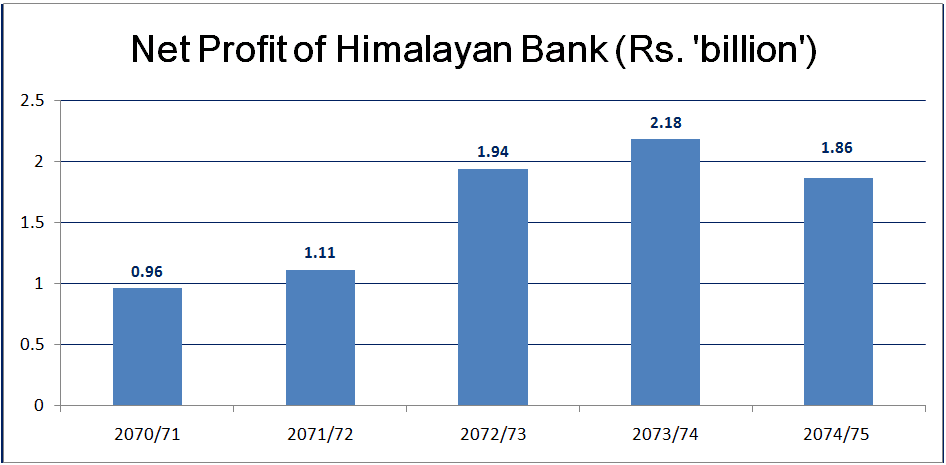
Himalayan Bank has made a net profit of Rs. 1.86 billion at the end of fiscal year 2074/75. This is a decline of almost 15 percent from the previous year’s profit. In 2073/74, the bank made a profit of Rs. 2.18 billion. With the change in accounting treatment to NFRS, the bank reported a decline in profit. However, the profit has grown by almost double from 2070/71. The bank had made a profit of Rs. 0.96 billion in 2070/71. Until the third quarter of this fiscal year (2075/76), the bank has reported a profit above Rs. 2 billion.
Also Read: Net Profit of Commercial Banks in Nepal [With Ranking]
The net profit of Himalayan Bank in the last five years period is shown in the table below:
| Fiscal Year | Net Profit (Rs. ‘billion’) |
| 2070/71 | 0.96 |
| 2071/72 | 1.11 |
| 2072/73 | 1.94 |
| 2073/74 | 2.18 |
| 2074/75 | 1.86 |
Net Profit of Himalayan Bank in the last five years: In the chart
Return On Equity (ROE) and Return On Assets (ROA)
The Return On Equity (ROE) of Himalayan Bank has declined in the past 3 years. ROE ranged from 13 to 22 percent in the five years period. The bank had the highest return on equity in the fiscal year 2072/73 which was 22 percent. After that period, the ROE declined with the sharp rise in the capital. In fiscal year 2074/75, ROE of the bank had declined to a low of Rs. 13.15 percent. This is mainly due to the decline in net profit.
Similarly, the return on assets (ROA) of the Himalayan bank has fluctuated between 1.28 percent to 2.01 percent. In fiscal year 2070/71, ROA stood at a minimum of 1.28 percent. Then, it gradually increased in the next three fiscal years. In fiscal year 2073/74, Return on assets stood at high of 2.01 percent. After reaching the peak value, ROA declined to 1.57 percent in 2074/75 due to the decline in net profit.
The Return on equity (ROE) and Return On Assets (ROA) of Himalayan Bank in the last five years period are shown in the table below:
| Fiscal Year | Return on Equity (ROE %) | Return on Assets (ROA %) |
| 2070/71 | 15.79 | 1.28 |
| 2071/72 | 15.95 | 1.31 |
| 2072/73 | 22.00 | 1.92 |
| 2073/74 | 18.62 | 2.01 |
| 2074/75 | 13.15 | 1.57 |
Earnings Per Share (EPS) and Non-Performing Loans (NPL)
The Earnings Per Share (EPS) of the Himalayan Bank has remained relatively consistent in the last five years. The EPS has ranged from 23 percent to 43 percent. This is comparatively good considering the huge capital size of commercial banks. The bank had the highest earnings per share of Rs. 43.03 in fiscal year 2072/73. However, the Earnings per share has declined after that. The EPS fell to Rs. 23.37 in the fiscal year 2074/75. The fall in EPS is mainly due to increment in capital and decline/slow growth in net profit.
Similarly, the non-performing loans of the Himalayan Bank have fluctuated between 0.85 percent to 3.22 percent in the last five years. The bank had the highest NPL of 3.22 percent in fiscal year 2071/72. After that, NPL has declined gradually to a low of 0.85 percent in the fiscal year 2073/74. The quality of loans has increased in the last 3 years period. In fiscal year 2074/75, NPL stood at 1.11 percent which is reasonably okay. As of the third quarter this fiscal year, NPL has slightly increased to 1.19 percent.
The Earnings Per Share (EPS) and Non-Performing Loans (NPL) of the Himalayan bank in the last five years are shown in the table below:
| Fiscal Year | Earnings Per Share (EPS ‘Rs.’) | Non-Performing Loans (NPL %) |
| 2070/71 | 33.1 | 1.96 |
| 2071/72 | 33.37 | 3.22 |
| 2072/73 | 43.03 | 1.23 |
| 2073/74 | 33.55 | 0.85 |
| 2074/75 | 23.37 | 1.11 |
Earnings Per Share (EPS) of Himalayan Bank in the last five years: In the chart

Dividend History of Himalayan Bank
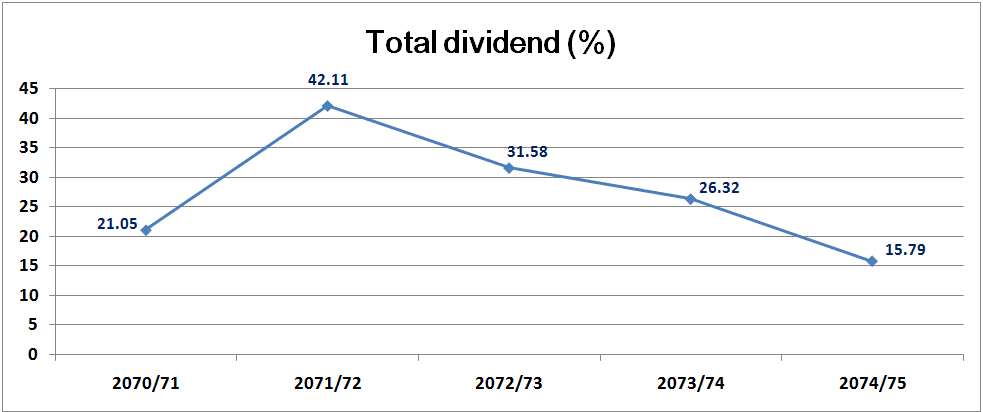
Himalayan Bank has provided a consistent dividend return to the shareholders. The dividend payout has ranged from 15 percent to 42 percent in the last 5 years. In the fiscal years from 2071/72 to 2073/74, the bank provided a bonus share of 35 percent, 30 percent, and 25 percent respectively. In order to reach the paid-up capital of Rs. 8 billion, the bank focused heavily on bonus share during this period. After the capital was met, the dividend declined to 15.79 percent in the fiscal year 2074/75. This includes a 5 percent bonus share to the shareholders. The decline in dividend is due to the huge rise in the capital. Also, the net profit declined in fiscal year 2074/75.
You May Also Like: Dividend History Of Commercial Banks Of Nepal
The dividend distributed by Himalayan Bank in the last five years is shown in the table below:
| Fiscal Year | Bonus share (%) | Cash dividend (%) | Total dividend (%) |
| 2070/71 | 15 | 6.05 | 21.05 |
| 2071/72 | 35 | 7.11 | 42.11 |
| 2072/73 | 30 | 1.58 | 31.58 |
| 2073/74 | 25 | 1.32 | 26.32 |
| 2074/75 | 5 | 10.79 | 15.79 |
Dividend History of Himalayan Bank in last 5 years: In the chart
Market Price and Market Capitalization of Himalayan Bank
Himalayan Bank has remained as one of the blue-chip stock in the Nepalese stock market. Investors have highly valued the company’s stock due to its consistent growth and good dividend distribution. The market price rose to a high of Rs. 1,500 per share in 2073/74. Then it crashed with the decline in the Nepse index. The price stood at Rs. 551 per share in the fiscal year 2074/75. Currently, the share is trading around Rs. 550.
You May Also Like: Price history of Himalayan Bank Limited
Likewise, with the rise and fall in share price, the market capitalization of the Himalayan Bank has remained highly fluctuating. In the fiscal year 2070-2072, the market capitalization stood at Rs. 27 billion. After that, the market value skyrocketed to Rs. 67.50 billion with the rise in the share price in fiscal year 2072/73. After the sharemarket crash, the market value also declined continuously. At the end of the fiscal year 2074/75, investors valued the company at Rs. 44.69 billion.
The market price per share and the market capitalization of Himalayan Bank in the last five years are shown in the table below:
| Fiscal Year | Market Price Per Share (MPS ‘Rs’) | Market Capitalization (Rs. ‘billion’) |
| 2070/71 | 941 | 27.29 |
| 2071/72 | 813 | 27.07 |
| 2072/73 | 1,500 | 67.50 |
| 2073/74 | 886 | 57.50 |
| 2074/75 | 551 | 44.69 |
Market Capitalization of Himalayan Bank in the last five years: In the chart

Financial Analysis of Himalayan Bank Limited: Third Quarter, 2075/76
Balance Sheet Analysis
Based on the unaudited third-quarter report of fiscal year 2075/76, Himalayan Bank has shown average growth in performance in the nine months. The paid-up capital has increased by five percent to Rs. 8.52 billion. This is due to the adjustment of the five percent bonus share. Likewise, the reserve and surplus have improved by almost 12 percent. The reserve of the bank remains at Rs. 6.74 billion, up from 6.02 billion in 9 months period.
Similarly, the Himalayan bank has grown the deposit collection by 9.69 percent in a period of nine months. The deposits are at Rs. 108.58 billion until the third quarter of this fiscal year. At Ashad end, 2074/75 the bank had a total deposit collection of Rs. 98.99 billion. Likewise, the loans and advances of the bank have increased by 13.70 percent in the nine months of this fiscal year. The loan portfolio stood at Rs. 93.78 billion until the third quarter. Until the last fiscal year, the loans amounted to Rs. 82.48 billion.
The comparative third-quarter report of Himalayan Bank is shown in the table below:
| Headings | 3rd Qtr, F.Y. 2075/76 | Ashar end, F.Y. 2074/75 | Percent Change |
| Paid-up capital (Rs. ‘billion’) | 8.52 | 8.11 | 5.06 |
| Reserve and Surplus (Rs. ‘billion’) | 6.74 | 6.02 | 11.96 |
| Deposits (Rs. ‘billion’) | 108.58 | 98.99 | 9.69 |
| Loans & Advances (Rs. ‘billion’) | 93.78 | 82.48 | 13.70 |
Income and ratio analysis
If we look at the profitability of the Himalayan Bank, the net profit has increased by 9.84 percent. The bank earned Rs. 2.01 billion in the nine months of this fiscal year. Last year, the bank had made a profit of Rs. 1.83 billion until the third quarter. The rise in profit is due to an increase in net interest income. The net interest income of the Himalayan Bank has increased by 17.19 percent to Rs. 3.75 billion. This is the rise from the corresponding quarter of the previous year (Rs. 3.2 billion).
Similarly, the Himalayan bank has accumulated a distributable profit of Rs. 2 billion in the nine months period. This gives the bank the dividend-paying capacity above 30 percent (when annualized). The annualized Earning Per Share (EPS) is Rs. 31.52 which is satisfactory. However, Non-Performing Loans (NPL) have increased by 10 percent to 1.31 percent. The base rate of the Himalayan Bank stands at 9.10 percent, which is a decline from last year 9.42 percent.
The performance of Himalayan Bank in the third quarter of F.Y. 2075/76 is shown in the table below:
| Headings | 3rd Qtr, F.Y. 2075/76 | 3rd Qtr, F.Y. 2074/75 | Percent Change |
| Net Interest Income (Rs. ‘billion’) | 3.75 | 3.2 | 17.19 |
| Net Profit(Rs. ‘billion’) | 2.01 | 1.83 | 9.84 |
| Distributable Profit (Rs. ‘billion’) | 2 | 1.85 | 8.11 |
| Annualized Earnings Per Share, EPS(Rs.) | 31.52 | 30.02 | 5.00 |
| Non Performing Loans, NPL(%) | 1.31 | 1.19 | 10.08 |
| Base rate(%) | 9.1 | 9.42 | -3.40 |
Conclusion
The performance of the Himalayan Bank looks satisfactory. The company has provided a decent return to the shareholders for a long period of time. It is one of the blue-chip stock in the Nepalese Share market. Investors have remained optimistic about the bank and its performance.
Himalayan Bank has led the Nepalese Banking sector along with the likes of Nabil Bank, Nepal Investment Bank, Everest Bank, etc. However, the bank has fallen behind lately. There is intense competition from other relatively newly established banks such as Global IME Bank, NMB Bank, Siddhartha Bank and so on. To maintain the past and current market share in the future remains a challenge for the bank.
NOTE: Figures of FY 2074/75 are as per NFRS and the figures of the earlier year are as per previous GAAP. Hence, they may not be comparable.
(Investments are subject to market risks and investors are advised to do personal homework before making any investment decision. This material is just a guideline for the investors to do further investigations)
Read Related Contents:
An Exclusive Financial Analysis of Global IME Bank
Account group le yo project report banauda hunx ki nai