
A Study on Foreign Exchange Earnings from Tourism in Nepal (1974/75 to 2023/24)
August 5, 2025 | Investopaper
This study provides a comprehensive analysis of foreign exchange earnings from tourism in Nepal over a 50-year period (1974/75 to 2023/24). The study examines trends, economic contributions, and the impact of major disruptions, notably the COVID-19 pandemic. Key findings include a strong upward trend in earnings until 2019, an 88.1% drop in 2020/21 due to the pandemic, and a robust recovery thereafter.
1. Introduction
Tourism is a cornerstone of Nepal’s economy, significantly contributing to foreign exchange earnings and gross domestic product (GDP). This study analyzes foreign exchange earnings from tourism over a 50-year period (1974/75 to 2023/24), examining trends, economic contributions, and resilience against disruptions such as the COVID-19 pandemic.
2. Data and Methodology
Data Source
The dataset comprises annual foreign exchange earnings from tourism in Nepal, expressed in Rs. 10 million, alongside their contributions to merchandise exports, goods and services exports, total foreign exchange earnings, and GDP. The data spans from 1974/75 to 2023/24, sourced from Nepal Rastra Bank.
Methodology
The analysis was conducted with the following steps:
Data Preprocessing: Categorized data into decades (1970s to 2020s).
Descriptive Statistics: Computed summary statistics and year-over-year growth rates.
Analysis: Visualized earnings trends, percentage contributions, and decade-wise comparisons.
3. Descriptive Statistics
Table 1 presents summary statistics for key variables. Total foreign exchange earnings ranged from Rs. 17.06 million (1974/75) to Rs. 8232.66 million (2023/24), with a mean of Rs. 1868.27 million. The contribution to merchandise exports averaged 39.38%, peaking at 74.3% in 1982/83. Tourism’s share of GDP averaged 2.37%, with a maximum of 4.1% in 1993/94 and 1994/95.
Table 1: Summary Statistics of Tourism Earnings and Economic Indicators
| Metric | Min | 1st Qu. | Median | Mean | Max |
|---|---|---|---|---|---|
| Total FE Earnings (Rs. 10M) | 17.06 | 169.19 | 953.86 | 1868.27 | 8232.66 |
| % Merchandise Exports | 5.10 | 27.62 | 37.90 | 39.38 | 74.30 |
| % Goods & Services Exports | 3.30 | 13.62 | 19.55 | 18.64 | 28.50 |
| % Total FE Earnings | 0.50 | 5.33 | 13.30 | 14.39 | 37.30 |
| % GDP | 0.20 | 1.73 | 2.30 | 2.37 | 4.10 |
Key Insights:
Time Span: 50 years (1974/75 to 2023/24).
Peak Earnings: Rs. 8232.66 million in 2023/24.
Lowest Earnings: Rs. 17.06 million in 1974/75.
Average Annual Growth: 23.47%.
COVID-19 Impact: An 88.1% drop in earnings in 2020/21.
4. Analysis
Overall Trends
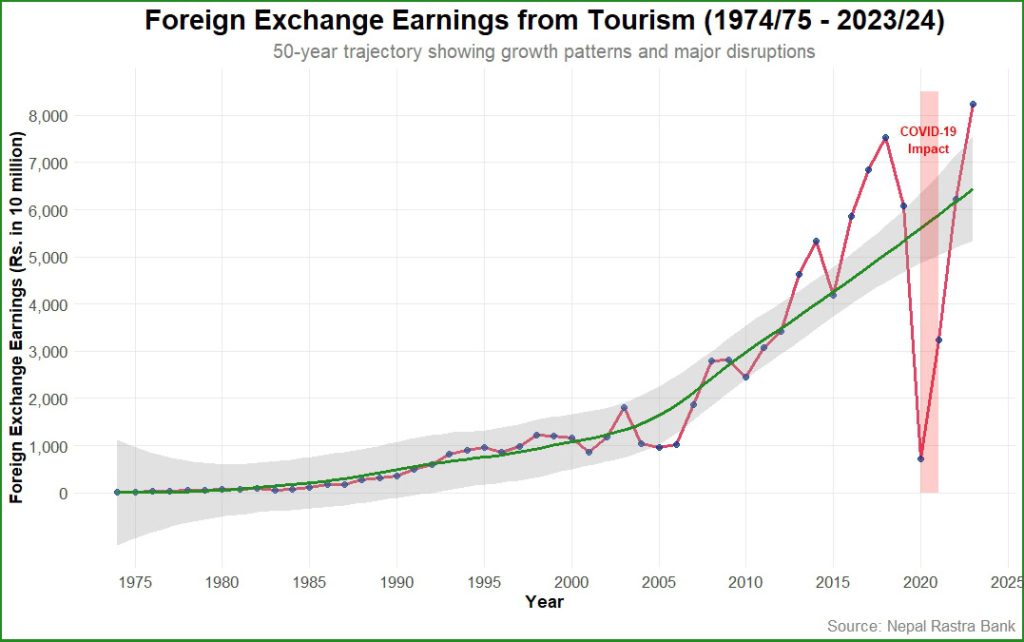
The tourism sector exhibited a strong upward trend in foreign exchange earnings from 1974 to 2019, interrupted by significant disruptions, notably the COVID-19 pandemic in 2020/21. The smoothed trend line highlights rapid growth in the 1980s and 2010s, with a pronounced recovery in 2022/23 and 2023/24.
Figure 1: Foreign Exchange Earnings from Tourism in Nepal (1974/75–2023/24)
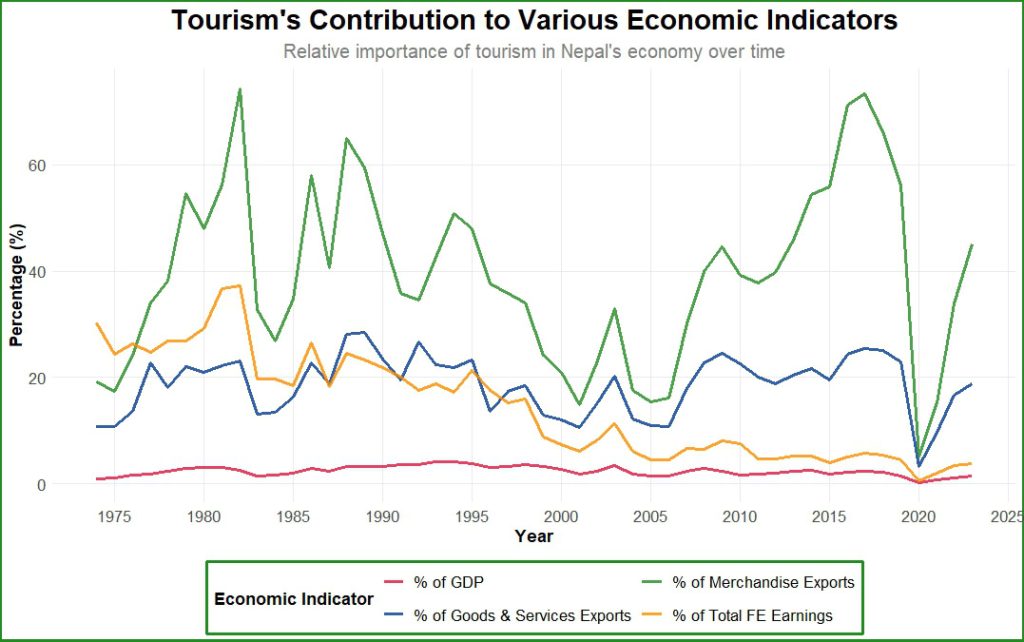
Percentage Contributions
Tourism’s contribution to economic indicators varied over time. The percentage of merchandise exports peaked at 74.3% in 1982/83, while the contribution to GDP was highest at 4.1% in 1993/94 and 1994/95. The share of total foreign exchange earnings declined from 37.3% in 1982/83 to 3.8% in 2023/24.
Figure 2: Tourism’s Contribution to Various Economic Indicators
Decade-wise Analysis
Table 2 summarizes earnings by decade. The 2010s recorded the highest average earnings (Rs. 4944 million), while the 2020s showed a lower average (Rs. 4609 million) due to the COVID-19 impact. The 1990s had the highest GDP contribution (3.56%).
Table 2: Decade-wise Summary of Tourism Earnings
| Decade | Avg. Earnings (Rs. 10M) | Avg. GDP Contribution (%) | Max Earnings (Rs. 10M) | Min Earnings (Rs. 10M) |
|---|---|---|---|---|
| 1970s | 36.1 | 1.83 | 63.7 | 17.1 |
| 1980s | 141.0 | 2.53 | 312.0 | 56.1 |
| 1990s | 840.0 | 3.56 | 1217.0 | 359.0 |
| 2000s | 1552.0 | 2.27 | 2814.0 | 865.0 |
| 2010s | 4944.0 | 2.04 | 7537.0 | 2461.0 |
| 2020s | 4609.0 | 0.89 | 8233.0 | 727.0 |
Figure 3: Average Tourism Earnings by Decade
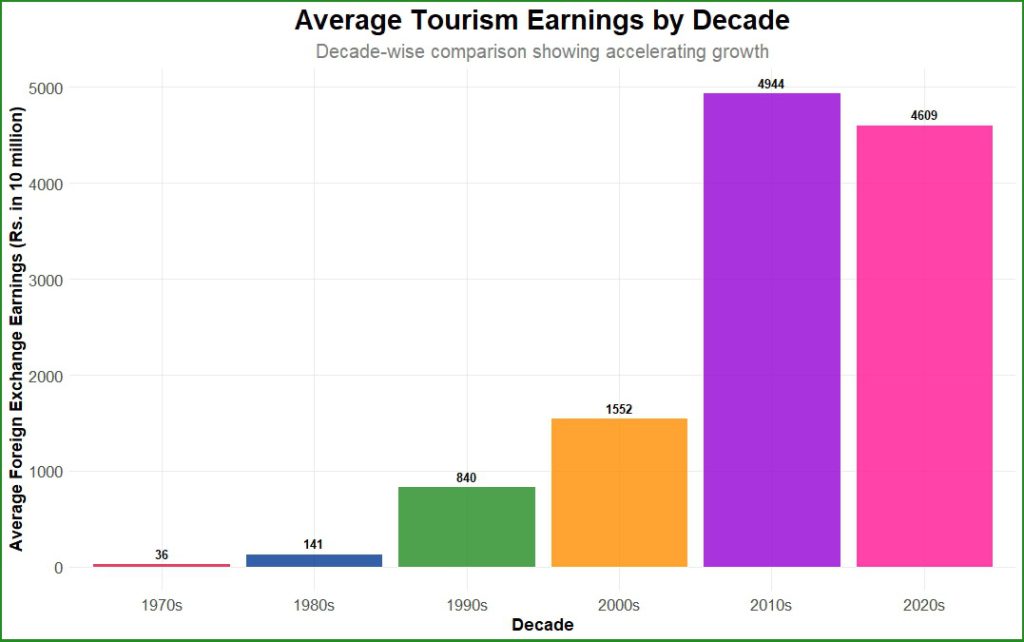
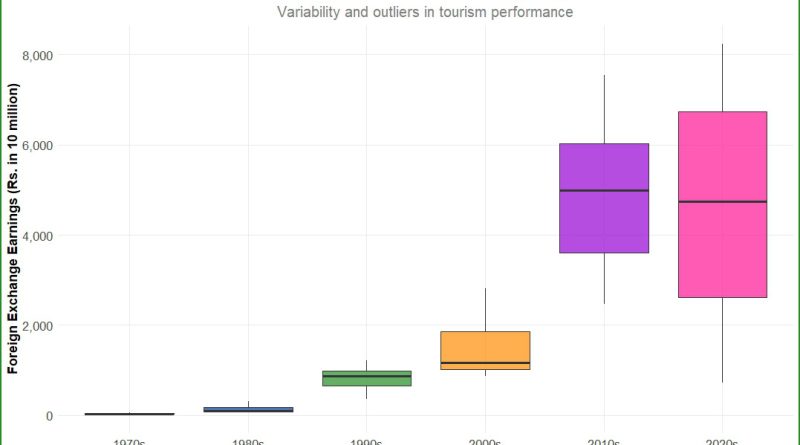
Figure 4: Distribution of Tourism Earnings by Decade

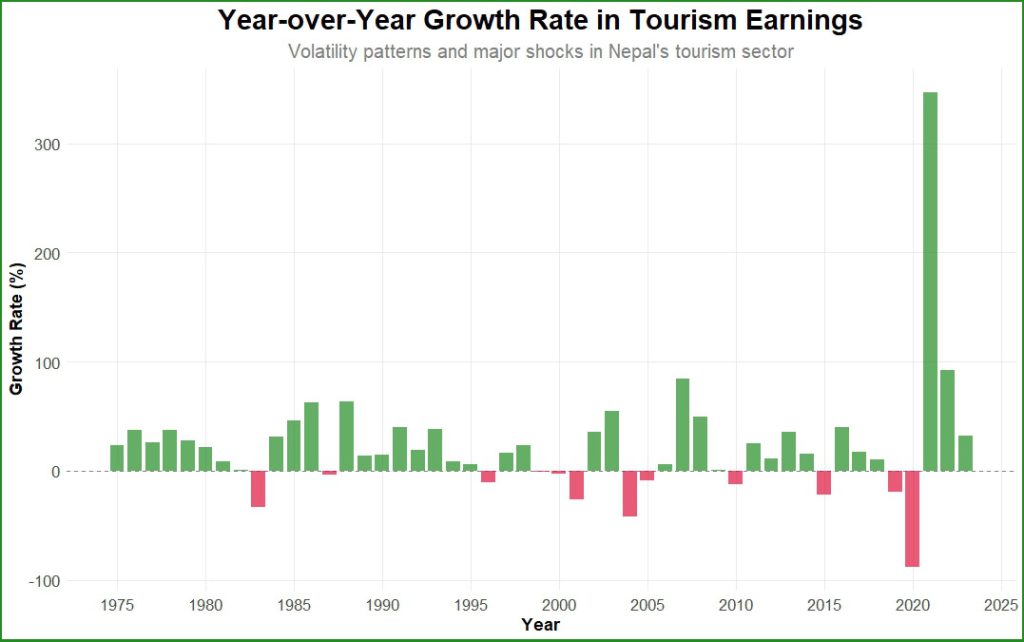
Volatility Analysis
Year-over-year growth rates showed significant volatility, with positive growth dominating except during major shocks (e.g., 1983/84, 2001/02, 2004/05, 2015/16 and 2020/21). The unprecedented negative growth of -88.1% in 2020/21 reflects the COVID-19 impact.
Figure 5: Year-over-Year Growth Rate in Tourism Earnings
5. Key Findings and Recommendations
Key Findings
— Strong upward trend in tourism earnings from 1974 to 2019, with an average annual growth rate of 23.5%.
— Peak performance in 2018/19 with Rs. 7537.4 million.
— Tourism’s share of GDP peaked at 4.1% in 1993/94 and 1994/95.
— An unprecedented 88.1% drop in earnings in 2020/21 due to COVID-19.
— Strong recovery in 2022/23 and 2023/24, reaching Rs. 8232.66 million in 2023/24.
6. Conclusion
Nepal’s tourism sector has demonstrated remarkable growth over the past five decades, despite significant challenges such as the COVID-19 pandemic. The strong recovery post-2020 highlight the sector’s resilience and potential. Strategic investments in sustainability, diversification, and infrastructure, coupled with effective crisis management, can position Nepal as a leading global tourism destination.
Recommended:
Comprehensive Analysis of Tourist Arrivals and Stay Patterns in Nepal (1964-2024)