

Financial analysis of Swabalamban Laghubitta
January 15, 2019 | Investopaper
The brief financial analysis of Swabalamban Laghubitta as performed by Investopaper team is as follows:
Introduction
Swabalamban Laghubitta (SWBBL) was registered with the Company Registrar’s Office as a limited company under the Companies Act, 2053 on Aswin 19, 2058 (October 5, 2001). It obtained a license from Nepal Rastra Bank on Poush 19, 2058 (January 3, 2002) to operate the financial activities under the Development Bank Act, 2052.
SWBBL started its operation from Magh 1, 2058 (January 14, 2002). The company’s registered Office is situated at Kathmandu, Nepal
Board of directors and the Management team of Swabalamban Laghubitta:
The board of directors includes:

The management team includes:

Major Shareholders of Swabalamban Laghubitta:
Swabalamban Laghubitta is promoted by Swabalamban bikas kendra, Nabil Bank, Nepal Investment Bank, Himalayan Bank, Mahila Sahakari Sanstha, and others. The major shareholders holding more than 0.5% shares of the company include:

Financial Highlights of Swabalamban Laghubitta: Last 5 Years
-
Paid up capital & Shareholders’ Fund:

The paid-up capital has increased from Rs. 14.99 crores in F.Y. 2070/71 to Rs.50.31 crores at the end of F.Y. 2074/75. Paid up capital has increased by 35.35% annually. The microfinance has increased the capital by providing bonus shares to the shareholders. This suggests that the company has strong profitability and is oriented towards the welfare of the Nepalese shareholders. The investors in Nepal prefer bonus shares more than a cash dividend. The current paid-up capital after 25% bonus stands at Rs. 62.89 crores.

The shareholders’ fund has also increased gradually by 29.25% annually. The company had Rs. 47.71 crores shareholders’ fund in F.Y. 2070/71. At the end of F.Y. 2074/75, the micro-finance has shareholders’ fund of Rs. 133.13 crores. The financial strength of the company has increased by almost 2.77 times in these five years.
-
Loans & Total Assets:

The microfinance has grown its loan portfolio by 27.34% annually. Loans & Advances was Rs. 3.86 Arab in F.Y. 2070/71. At the end of F.Y. 2074/75, the company has increased its loan portfolio to Rs. 10.15 Arab. As of first quarter 2075/76, the total loans & advances stand at Rs.10.89 Arab.

The total assets of the company at the end of F.Y. 2074/75 stands at Rs.11.71 Arab. In 2070/71, total assets stood at Rs. 4.83 Arab. This is an increase of 24.78% annually.
-
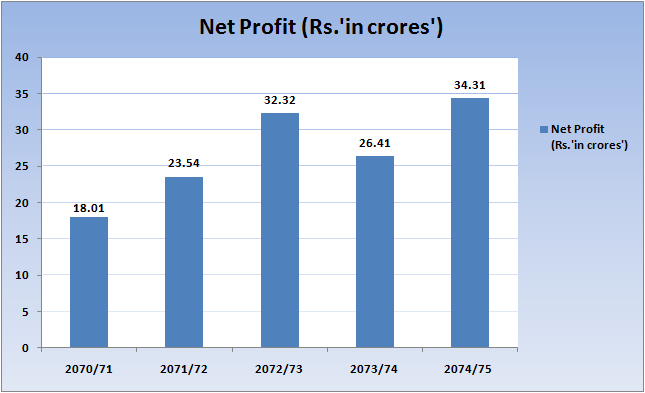
Net Profit & Market Capitalization:
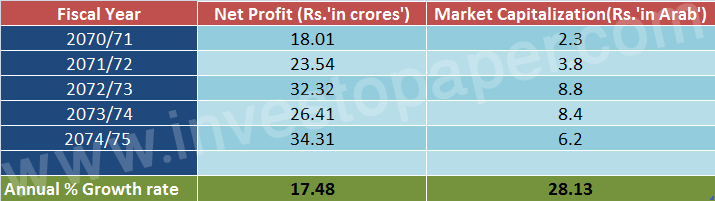
The net profit of the company increased at accelerating pace from F.Y. 2070/71 to F.Y. 2072/73. But due to the increase in the cost of fund in recent 2 years and the NRB direction to provide loans at a maximum 18%, the profitability decreased in F.Y. 2073/74 to Rs. 26.41 crores. In F.Y. 2074/75, the profit increased to Rs. 34.31 crores, a 30% growth from the previous year.
The market capitalization at the end of F.Y. 2074/75 stands at Rs. 6.2 Arab. The market value has increased by 28.13% annually. Investors peaked the market value (Rs. 8.8 billion) of the company in F.Y. 2072/73.

-
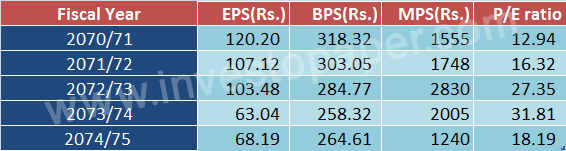
EPS, MPS, BPS & P/E ratio:
The earnings per share of the company remain strong in these five years. The company had an impressive EPS of Rs. 120.20 in F.Y. 2070/71. Due to increment in the capital by providing bonus shares, the EPS has gradually declined. At the end of F.Y. 2074/75, EPS stands at Rs. 68.19.
The networth per share is Rs. 264.61 at the year-end 2074/75. Net-worth has remained consistent above Rs. 250.
The share price closed the year 2072/73 at a price of Rs. 2830. The price has been continuously declining with fall in Nepse in last 2 years. The share price at end of 2074/75 stood at Rs. 1240.
P/E ratio stood at 18.19 in the year-end 2074/75. The company was valued at 31.81 times its earnings in year-end of F.Y. 2073/74.
-
Dividend History:

Swabalamban Laghubitta has been providing healthy dividends to the shareholders. The dividend payout is more focused towards bonus shares. The company has been consistently providing bonus shares to the shareholders. However, the dividend per share has declined gradually due to high growth in capital. The dividend of F.Y. 2074/75 stood at 36.84% including 25% bonus shares.

-
Non-Performing Loans(NPL), Cost of fund and Interest spread
The NPL of the Swabalamban Laghubitta remains at a tolerable level. NPL stands at 1.02% as of F.Y. 2074/75.
Cost of fund has increased in the previous two years due to the overall increase in the cost of the banking sector. The recurrent credit crisis has pushed the cost of the microfinance to 8.78% in F. Y. 2074/75.
The direction by Nepal Rastra Bank to provide loans at most 18% has diminished the interest margin of the microfinance sector. The interest rate spread has declined from 15.88% in 2071/72 to 6.9% as of fiscal year 2074/75.

-
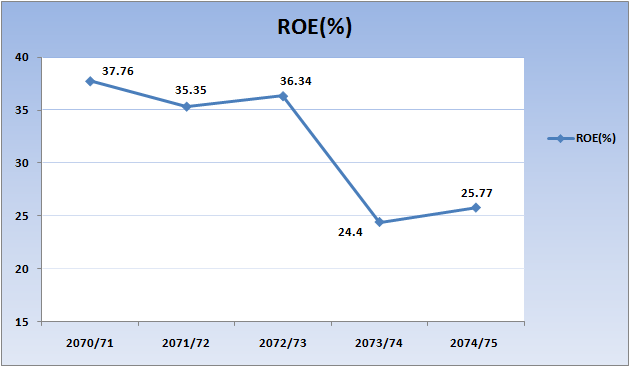
Return On Equity(ROE) & Return On Assets(ROA):
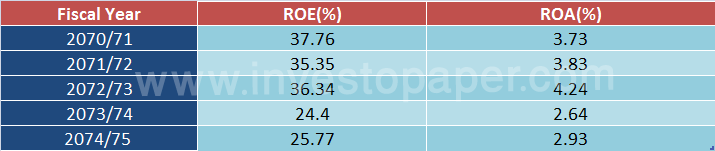
ROE & ROA of Swabalamban microfinance stood at 25.77% and 2.93% in F.Y. 2074/75. This is above average return. However, considering the previous years, ROE & ROA have declined from 37.76% and 4.24%. This is mainly due to slower growth in net profit as compared to growth in shareholders’ equity and total assets.

Financial Highlights of Swabalamban Laghubitta: 1st Qtr 2075/76
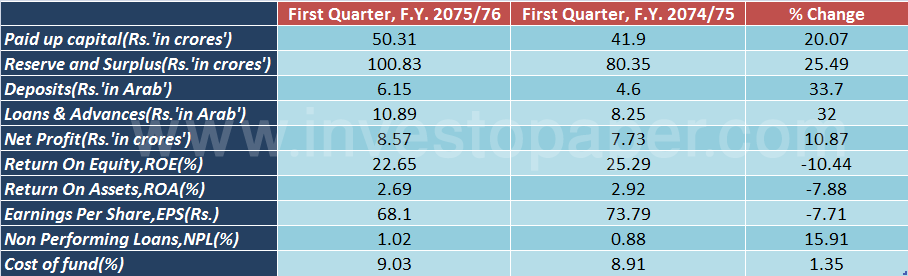
The first quarter of Swabalamban Lagubitta remains satisfactory. Paid up capital increased by 20% due to the adjustment of bonus shares. Reserve & Surplus improved by 25% to Rs. 100.83 crores. Deposits & Loans have grown by almost 34% and 32% respectively. Net profit has risen by 11% to Rs. 8.57 crores.
EPS of the microfinance at the first quarter stands at Rs. 68.1. ROE & ROA remain at 22.65% and 2.69%. NPL has increased by 16% to 1.02. Cost of the fund has risen slightly by 1.35% to 9.03.
Past investment returns of SWBBL stock

SWBBL stock has provided an impressive 21% return to the shareholders. The return doesn’t include the reinvestment return of cash dividends. If one had invested Rs. 1 lakh at the end of F. Y. 2070/71, he would have a total value of Rs. 2.36 lakh after four and a half years. During this period, the company provided Rs. 9,721 as a cash dividend. Also, the initial share of 64 would have grown to 268.
Future Prospects and challenges
The high cost of fund remains the major challenge for the microfinance. With the cost of funds at 9%, the interest margin has shrunk to 6.9% from as high as 15.88% in F.Y. 2071/72. The NRB directive to provide the loans at most 18% has penalized the earnings. With a 9% cost of fund & 5-6% cost for management expenses, the microfinance has been working on a 2-3% margin. This is considerably lower looking at the riskiness of the business. Thus, it is highly challenging for the microfinance to generate the consistent profit growth of the past. The expansion of quality credit also seems difficult due to high competition and double lending among microfinance.
However, the able management seems capable to grow the business at a steady pace. Swabalamban has shown satisfactory results in the first three months in this fiscal year. Under the current leadership of highly experienced Mr. Bhojraj Bashyal, we can expect that the company will continue to grow for the foreseeable future.
Decision
The fundamentals of the company remain strong. Looking at the financial aspect and past performance, we suggest the investors hold the company for the long term. The current sectoral crisis seems transitory. With the decrease in interest rate, the profit will gradually increase in the long run. Also, the microfinance is planning to issue FPO worth Rs. 10.48 crores. This will further increase the financial strength of the company.
For short term investors, we provide the advice to ‘Wait and watch’. Increasing the profit rapidly in a short period of time seems unattainable.
(Investments are subject to market risks and investors are advised to do personal homework before taking any investment decision. This material is just a guideline for the investors to do further investigations)
This article describe the all segment of SWBBL, and fine analysis of the company, which is very beneficial for investors and others. Company is very strong and running smoothly promoted by renounced banks and Swabalamban Bikas Kedra possesses the very good image among people. The shareholders fund is more than double compare with paid up capital of the company. All financial indicators seems quite sound and trust-able for investors. Thanks Investopaper for minute analysis.