

A Study on Evolution and Growth of Banks & Financial Institutions in Nepal
October 26, 2025 | Investopaper
The banking sector in Nepalhas experienced remarkable transformation over the past four decades, transitioning from a initial stage with just 4 institutions in 1983 to a peak of 218 in 2011, before consolidating to 106 by early 2025. This study analyzes the sector’s growth trajectories across commercial banks, development banks, finance companies, microfinance institutions, and insurance companies, using descriptive statistics, visualizations, and advanced metrics like the Herfindahl-Hirschman Index (HHI) proxy for market concentration.
Key findings include:
Expansion and Peak (2001-2015): Rapid proliferation, with development banks peaking at 88 in 2012 and finance companies at 79 in 2010.
Consolidation Phase (2016-2025): A 51.4% decline from peak totals, driven by regulatory restructuring, with microfinance now dominating at 49.1% of the market.
Recent Trends: All major BFI categories are declining (2020-2025), signaling a maturing market.
Market Diversification: HHI values have trended downward, indicating reduced concentration and a more balanced structure post-2015.
Related: Current Status of Banking in Nepal
1. Introduction
Nepal’s financial sector has evolved significantly since the 1980s, influenced by economic reforms, liberalization policies in the 1990s, and regulatory interventions by the Nepal Rastra Bank (NRB). From a monopolistic landscape dominated by state-owned entities, the sector expanded into a diverse ecosystem of commercial banks, development banks, finance compan., reflecting broader financial inclusion efforts.
This study examines data spanning 1983 to 2025, capturing 42 years of growth, stagnation, and restructuring. The analysis highlights compositional shifts, growth dynamics, and concentration trends.
2. Data & Methodology
The dataset comprises annual observations (n=42) on key variables:
Year: 1983–2025.
Institution Types:
— Commercial Banks
— Development Banks
— Finance Companies
— Microfinance
— Total BFIs
— Insurance Companies
Temporal periods were categorized for trend analysis:
| Period | Description |
|---|---|
| 1983-1990 | Foundation |
| 1991-2000 | Early Growth |
| 2001-2010 | Expansion |
| 2011-2015 | Peak & Consolidation |
| 2016-2020 | Restructuring |
| 2021-2025 | Stabilization |
The key techniques expored in the analysis include:
Descriptive statistics (min, max, mean, median, SD).
Period-based grouping
Growth rate calculations (year-over-year percentage change).
Advanced metrics (HHI proxy for concentration).
Visualizations (stacked areas, heatmaps, boxplots, dual-axis lines).
3. Summary Statistics
3.1 Overall Descriptive Statistics
The table below summarizes key metrics across all institution types (1983–2025). Commercial banks exhibit the highest stability (low SD), while development banks and microfinance show volatility.
| Institution Type | Min | Max | Mean | Median | SD |
|---|---|---|---|---|---|
| Commercial_Banks | 2 | 32 | 17.0 | 17 | 9.8 |
| Development_Banks | 2 | 88 | 25.2 | 14 | 29 |
| Finance_Companies | 0 | 79 | 34.2 | 30 | 26.8 |
| Microfinance | 0 | 90 | 21.9 | 11 | 25.8 |
| Total_BFIs | 4 | 218 | 98.3 | 100 | 70.9 |
| Insurance_Companies | 4 | 41 | 19 | 17.0 | 12.2 |
3.2 Period-Wise Averages
Averages reveal phased growth: Explosive increases during 2001–2015, followed by declines.
| Period | Avg. Commercial Banks | Avg. Development Banks | Avg. Finance Companies | Avg. Microfinance | Avg. Total BFIs | Avg. Insurance Companies |
|---|---|---|---|---|---|---|
| 1983-1990: Foundation | 4.0 | 2.0 | 0.0 | 0.0 | 6.0 | 4.4 |
| 1991-2000: Early Growth | 9.5 | 3.6 | 28.3 | 3.8 | 45.2 | 9.4 |
| 2001-2010: Expansion | 19.8 | 33.7 | 65.5 | 12.0 | 131.0 | 20.1 |
| 2011-2015: Peak & Consolidation | 30.8 | 84.2 | 61.8 | 30.2 | 207.0 | 25.2 |
| 2016-2020: Restructuring | 27.8 | 37.8 | 28.0 | 67.0 | 161.0 | 34.6 |
| 2021-2025: Stabilization | 22.8 | 17.2 | 17.0 | 59.2 | 116.0 | 37.8 |
Takeaway: Total BFIs grew 34x from foundation to peak but halved in stabilization, with microfinance rising from negligible to dominant.
4. Visualizations and Key Takeaways
4.1 Evolution of Financial Institutions
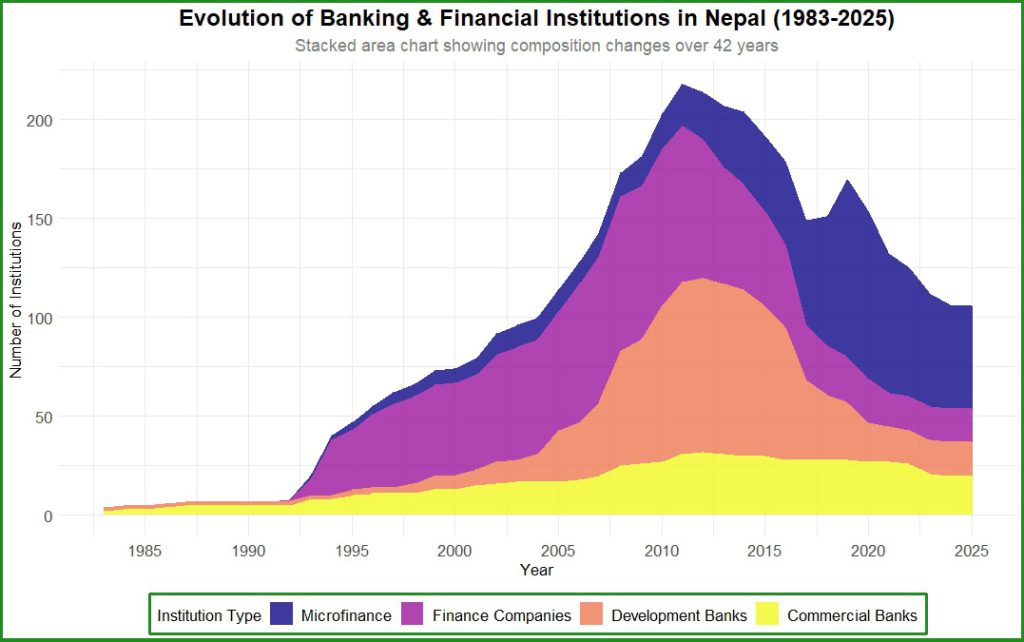
Key Observation: Steady layering from 1983 (minimal coverage) to 2011 (full height at 218), then contraction. Microfinance’s layer surges post-2015, overtaking others by 2025.
4.2 Growth Rate Dynamics
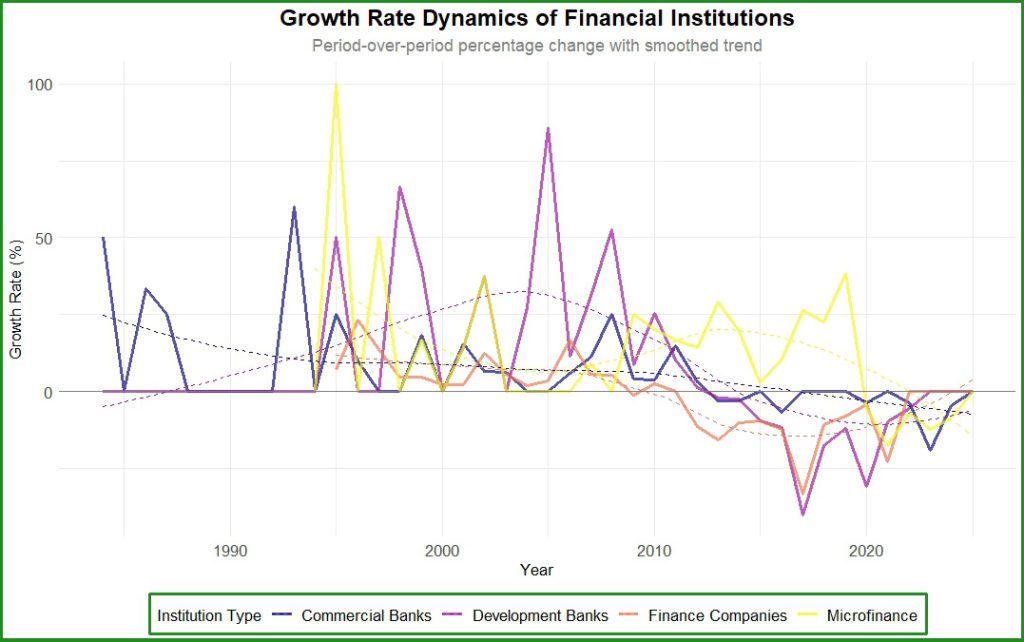
Key Observation: High volatility in 2000s (e.g., finance companies >100% spikes), tapering to negative trends post-2015. Microfinance shows the steadiest recent decline (-20% avg.).
Insight: Early growth fueled liberalization; current negatives signal saturation and mergers.
4.3 Market Share Composition
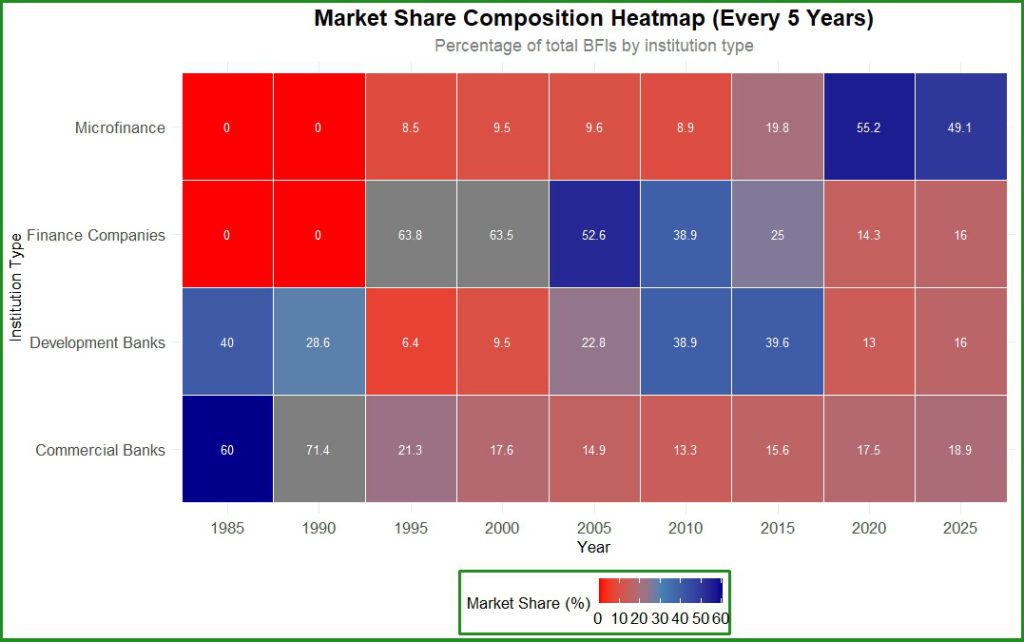
Key Observation: Commercial banks hold ~20-30% consistently; development banks peak at 40% (2010), microfinance at 49% (2025).
Insight: Shift from commercial dominance (1980s) to microfinance-led inclusion (2020s).
4.4 Banking vs. Insurance Growth
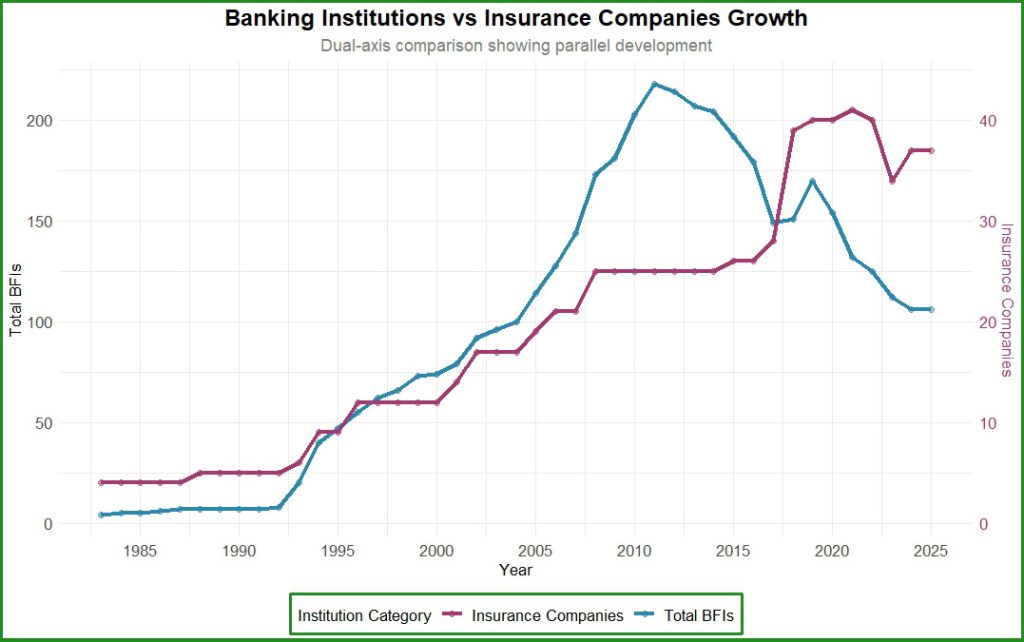
Key Observation: Parallel upward trajectories until 2015, with insurance lagging but accelerating. Post-peak, both stabilize.
4.5 Distribution Across Periods
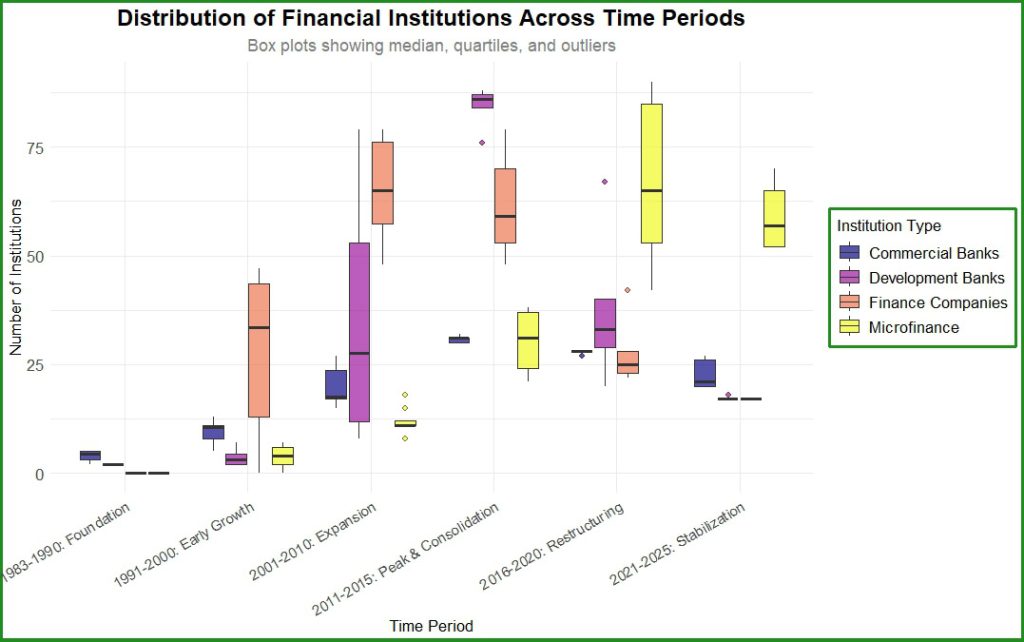
Key Observation: Widest spreads in 2011-2015 (e.g., development banks IQR: 70-90); medians drop sharply post-2020.
Insight: Outliers in expansion phase indicate uneven regional rollout; recent tightening shows normalization.
4.6 Market Concentration
HHI proxy (squared shares sum) over time, with dashed threshold at 0.25 (high concentration).
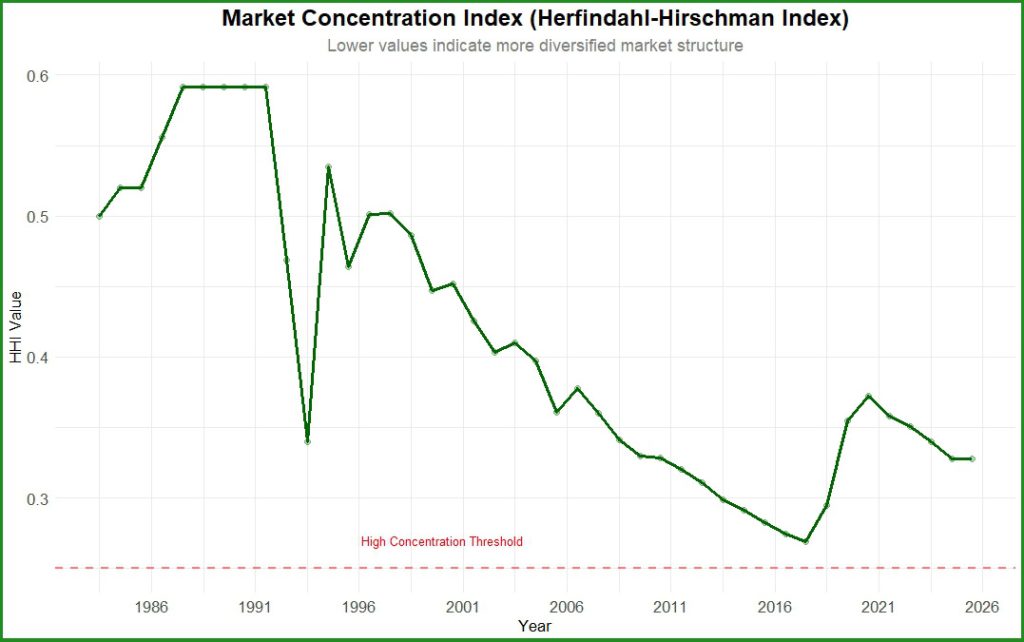
Key Observation: HHI falls from ~0.6 (1980s monopoly) to ~0.2 (2025), dipping below threshold post-2000.
Insight: Increasing diversification reduces systemic risk but may fragment oversight.
5. Advanced Analytics
5.1 Peak vs. Current Comparison
| Category | Peak Value (Year) | Current (2025) | % Change from Peak |
|---|---|---|---|
| Commercial Banks | 32 (2012) | 20 | -37.5% |
| Development Banks | 88 (2012) | 17 | -80.7% |
| Finance Companies | 79 (2010) | 17 | -78.5% |
| Microfinance | 90 (2019) | 52 | -42.2% |
6. Key Insights
Peak Periods:
- Commercial Banks: 32 (2012)
- Development Banks: 88 (2012)
- Finance Companies: 79 (2010)
- Microfinance: 90 (2019)
- Total BFIs: 218 (2011)
Current Status (January 2025):
- Total BFIs: 106 (-51.4% from peak)
- Microfinance dominates: 49.1% of total
Recent Trends (2020-2025):
- Commercial Banks: Declining
- Development Banks: Declining
- Finance Companies: Declining
- Microfinance: Declining
7. Conclusion
Nepal’s BFI sector has matured from foundational scarcity to expansive diversity, now entering a stabilization phase. The 42-year arc—from 4 institutions in 1983 to a 2025 landscape led by microfinance—demonstrates resilience amid challenges like political instability and the 2015 earthquake and COVID-19.
More From Investopaper: