

A Study on Tourists Arrival in Nepal by Gender (1993–2023)
August 26, 2025 | Investopaper
1. Introduction
This study provides a comprehensive analysis of tourist arrivals in Nepal from 1993 to 2023, with a focus on gender distribution and growth trends. Understanding gender dynamics in tourist arrivals offers valuable insights for policy development and marketing strategies. Using data from the Nepal Tourism Board, the analysis employs statistical methods and visualizations to explore total arrivals, gender composition, growth rates, and structural changes. Key findings include significant tourism growth, a narrowing gender gap, and a robust recovery post-COVID-19, with 2023 arrivals reaching 92% of pre-COVID levels.
2. Data and Methodology
The dataset comprises annual tourist arrivals in Nepal from 1993 to 2023, disaggregated by gender (male and female), with variables including total arrivals, male and female tourist counts, and their respective percentages. The data was validated for completeness. Summary statistics, trend analysis, change point detection, and statistical modeling were conducted. Visualizations were created to illustrate trends, gender composition, and correlations. The methodology includes:
• Data validation and summary statistics.
• Year-over-year growth rate calculations.
• Gender disparity analysis, including gender gap and ratio metrics.
• Change point detection using the PELT algorithm.
• Linear trend modeling and correlation analysis.
• Period comparisons (pre-COVID, COVID, post-COVID).
Also Read:
Comprehensive Analysis of Tourist Arrivals and Stay Patterns in Nepal (1964-2024)
A Study on Foreign Exchange Earnings from Tourism in Nepal (1974/75 to 2023/24)
3. Results
3.1 Data Overview
The dataset contains 31 observations. Summary statistics are presented in Table 1.
Table 1: Summary Statistics of Nepal Tourism Data (1993–2023)
| Variable | Min | 1st Qu. | Median | Mean | 3rd Qu. | Max |
|---|---|---|---|---|---|---|
| Year | 1993 | 2000 | 2008 | 2008 | 2016 | 2023 |
| Male Tourists | 105,410 | 221,794 | 286,161 | 315,004 | 380,351 | 634,392 |
| Male Percentage (%) | 47.8 | 54.95 | 57.6 | 58.15 | 60.25 | 69.8 |
| Female Tourists | 45,552 | 136,013 | 205,343 | 240,376 | 346,525 | 562,799 |
| Female Percentage (%) | 30.2 | 39.75 | 42.4 | 41.88 | 45.05 | 52.2 |
| Total Arrivals | 150,962 | 369,397 | 491,504 | 555,399 | 744,609 | 1,197,191 |
3.2 Overall Tourism Trends
Tourist arrivals increased from 150,962 in 1993 to a peak of 1,197,191 in 2019, with an average annual growth rate of 5.6% (1993–2019).
The highest growth periods were:
- 2022: 307.3% growth (post-COVID recovery).
- 2023: 65.1% growth.
- 2016: 39.7% growth.
Significant declines occurred in:
- 2020: -80.8% (COVID-19 impact).
- 2021: -34.4% (continued COVID-19 effects).
- 2015: -31.8% (earthquake).
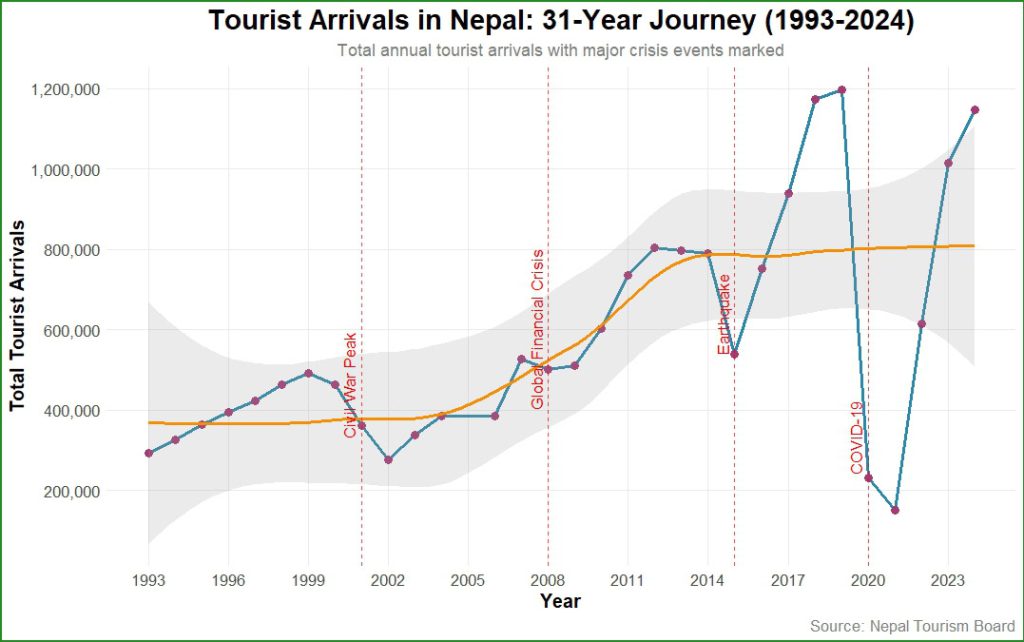
Figure 1: Tourists Arrival in Nepal
3.3 Gender Tourism Analysis
Male tourists dominated most years, averaging 58.1% of arrivals, compared to 41.9% for female tourists. The gender gap averaged 16.3 percentage points, with a maximum of 39.6 points in 2021 and a minimum of -4.4 points in 2011 (the only year with a female majority at 52.2%). The gender gap is narrowing, with a linear trend slope of -0.4034 percentage points per year (R² = 0.1486).
3.4 Change Point Analysis
Structural breaks in total tourism were detected in nearly every year, reflecting high variability. Notable shifts occurred in 2001–2002 (political instability), 2015 (earthquake), and 2020–2021 (COVID-19). Gender gap breaks were identified in 1995, 2001–2005, 2009–2011, 2014, and 2020–2022, indicating shifts in gender composition.
3.5 Statistical Insights
Correlation: Male and female tourist arrivals are strongly correlated (r = 0.971), suggesting similar responses to external factors.
Linear Trends:
Total arrivals: R² = 0.3283, slope = 16,900 tourists/year.
Male tourists: R² = 0.3073, slope = 8,318 tourists/year.
Female tourists: R² = 0.3405, slope = 8,579 tourists/year.
COVID-19 Impact: Average arrivals during the COVID period (2020–2021) were 190,524, compared to 580,562 in normal periods. The gender gap widened during COVID (23.7 vs. 15.7 points).
Recovery: 2022 arrivals (614,869) were 44.3% below the pre-COVID average (1,103,494, 2017–2019), while 2023 arrivals (1,014,882) reached 92% of pre-COVID levels.
3.6 Visualizations
Gender Composition: Stacked area chart of male and female tourist numbers.

Figure 2: Tourists Arrival By Gender
Gender Percentage Trends: Line plot of male and female percentages with a 50% reference line.

Figure 3: Gender Distribution Trends in Nepal Tourism
Gender Gap Analysis: Bar plot of the gender gap (Male % – Female %).

Figure 4: Gender Gap in Tourism in Nepal
Growth Rate Analysis: Line plots of year-over-year growth rates by gender.

Figure 5: Year-over-year growth rates by Gender
Correlation Analysis: Scatter plot of male vs. female tourists with a trend line.

Figure 6: Male Vs Female Tourists Correlation
4. Discussion & Conclusion
Nepal’s tourism sector has shown robust growth, interrupted by significant disruptions. The 80.8% decline in 2020 due to COVID-19 was unprecedented, but the recovery by 2023 (92% of pre-COVID levels) demonstrates resilience. The narrowing gender gap, with female representation peaking in 2011, suggests increasing female participation, possibly due to changing travel preferences. The strong correlation between male and female arrivals indicates that external factors affect both genders similarly. Structural breaks align with known events, confirming the sector’s sensitivity to external shocks.
More From Investopaper:
Nepal’s Hotel Sector Analysis: Growth, Trends, and Disruptions