
Nepal’s Hotel Sector Analysis: Growth, Trends, and Disruptions
August 22, 2025 | Investopaper
This comprehensive analysis examines the evolution of Nepal’s hotel and tourism sector from 1979 to 2024, using detailed data on hotel growth, bed capacity, and tourist arrivals. The study highlights significant growth trends, market dynamics, and key disruptions, including the impact of the COVID-19 pandemic and other major events. Utilizing advanced statistical methods and visualizations, it provides practical insights into the sector’s trajectory, market structure, and recovery patterns.
1. Introduction
Nepal’s hotel and tourism sector is a cornerstone of its economy, driven by the country’s rich cultural heritage, natural beauty, and strategic location. This study analyzes the sector’s growth from 1979 to 2024, focusing on the expansion of hotels, bed capacity, and tourist arrivals. Through exploratory data analysis, statistical modeling, and visualizations, this study uncovers key trends, market dynamics, and the impact of major disruptions, providing a detailed perspective on the industry’s resilience and future potential.
2. Methodology
The analysis utilizes two primary datasets:
Hotel Data (1979–2024): Includes annual data on star and non-star hotels, bed capacity, and total establishments.
Tourist Arrival Data (1993–2023): Tracks arrivals from Indian and third-country tourists, total arrivals, and year-over-year percentage changes.
Key metrics include compound annual growth rates (CAGR) and efficiency ratios (e.g., beds per hotel).
3. Key Findings
3.1 Hotel Industry Transformation
Overall Growth: The number of hotels in Nepal surged from 68 in 1979 to 1,578 in 2024, a 23.2-fold increase, with a CAGR of 7.2%. Bed capacity expanded from 4,925 to 62,642, a 12.7-fold increase, with a CAGR of 5.8%.
Market Structure: Non-star hotels dominate, comprising 86.4% of total hotels in 2024. The average beds per hotel decreased from 82.7 in the early years (1979–1983) to 37.4 in recent years (2020–2024), reflecting a shift toward smaller establishments.
Growth Patterns: Star hotels grew steadily, peaking at 214 in 2024, while non-star hotels saw exponential growth, particularly post-1990, reaching 1,364 in 2024.
3.2 Tourism Industry Dynamics
Peak and Recovery: Tourist arrivals peaked at 1,197,191 in 2019, driven by 978,749 third-country visitors and 254,150 Indian tourists. The COVID-19 pandemic caused an 87.4% decline to 150,962 arrivals in 2020. By 2023, arrivals recovered to 1,014,882, or 84.8% of the pre-COVID peak.
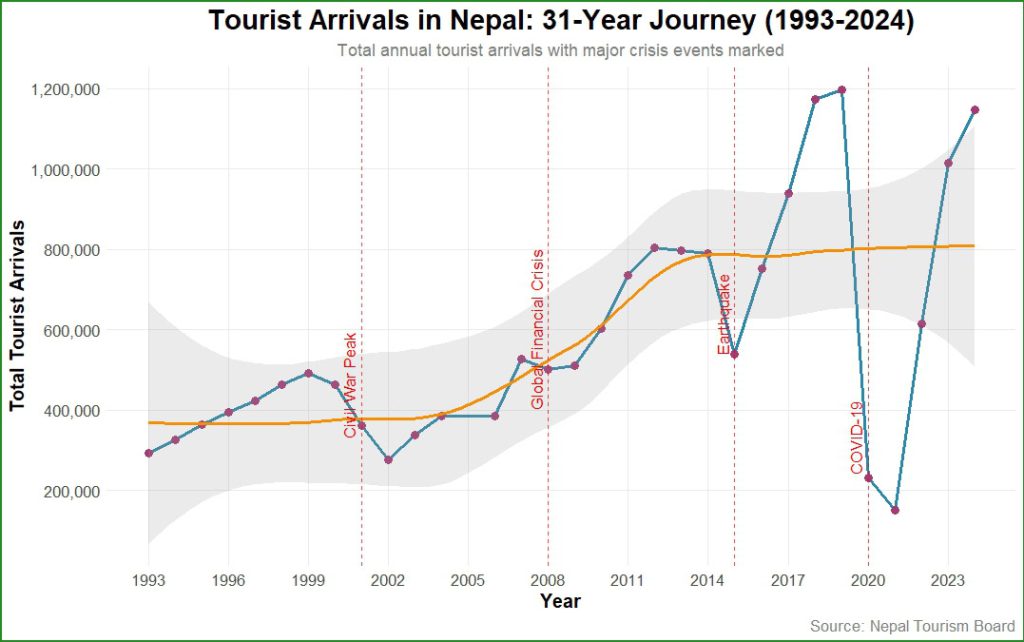
Figure 1: Tourists Arrival in Nepal
Market Share: Indian tourists accounted for 31.5% of arrivals in 2023, with third-country tourists dominating at 68.5%. The average annual growth rate for tourist arrivals was 13.8%, with high volatility (standard deviation of 60.3%).
Volatility: Significant fluctuations in arrivals were observed, with a 307.3% surge in 2022 post-COVID and a -80.7% drop in 2020.
3.3 Major Industry Disruptions
The sector faced several disruptions, as outlined in Table 1:
Table 1: Major Disruptions in Nepal’s Tourism Sector
| Year | Event | Impact |
| 2001 | Civl War Peak + Post-9/11 decline | Sharp decline in arrivals |
| 2008 | Global Financial Crisis | Moderate decline in tourist arrivals |
| 2015 | Earthquake impact | Tourism sector hit hard |
| 2020 | COVID-19 pandemic | Severe contraction |
4. Visual Analysis
4.1 Hotel Industry Evolution
The chart below illustrates the growth of star and non-star hotels from 1979 to 2024. Non-star hotels exhibited exponential growth post-1990, while star hotels grew steadily.
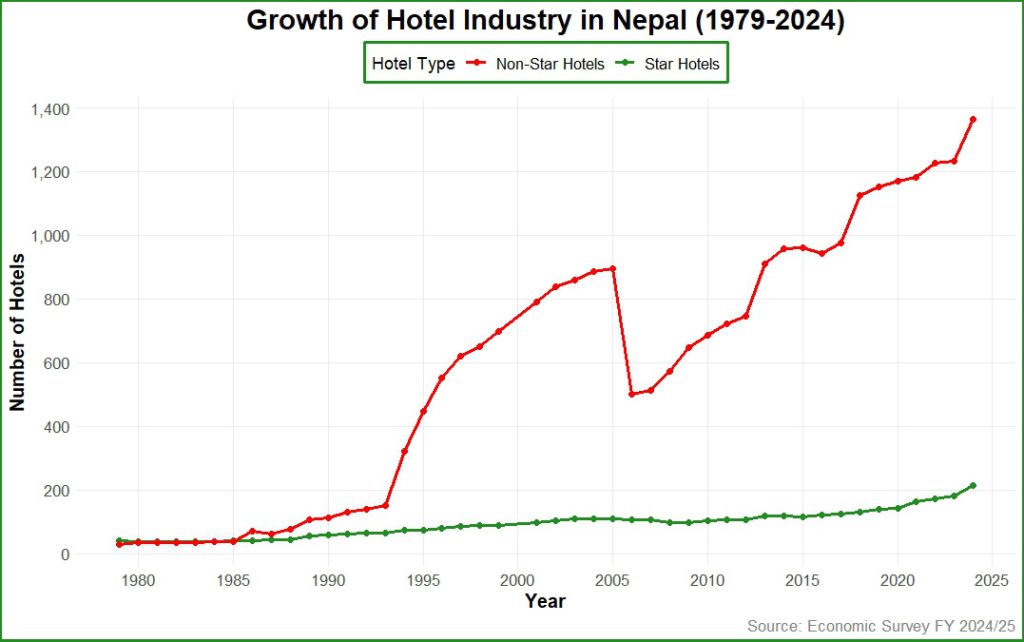
Figure 2: Growth of Hotel Industry in Nepal
4.2 Bed Capacity Growth
Figure 3 shows the cumulative bed capacity, with non-star hotels contributing significantly to the total capacity, particularly post-2010.
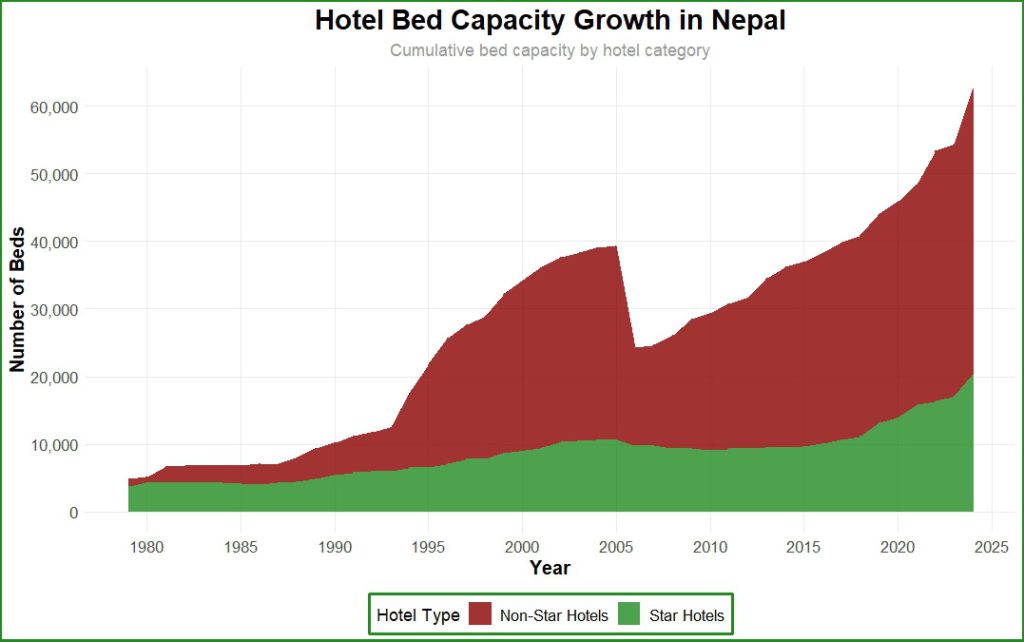
Figure 3: Growth of Hotel Bed Capacity
4.3 Tourist Arrival Trends
Figure 4 highlights the dominance of third-country tourists and the severe impact of the COVID-19 pandemic (2020–2021).
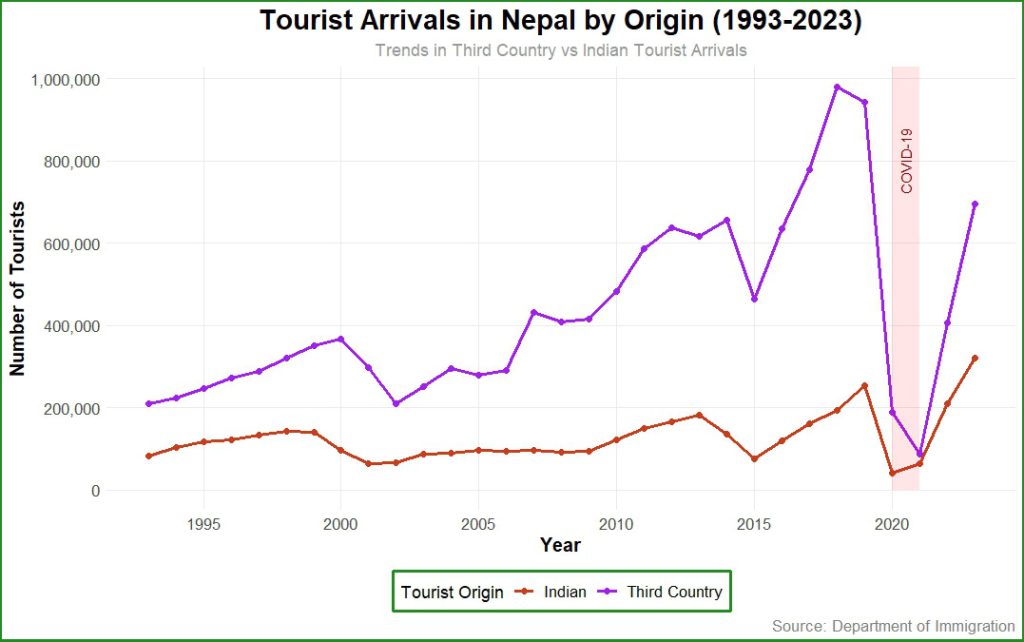
Figure 4: Tourists Arrival in Nepal by Origin
4.4 Market Share Distribution
The chart below shows the shifting share of Indian versus third-country tourists.
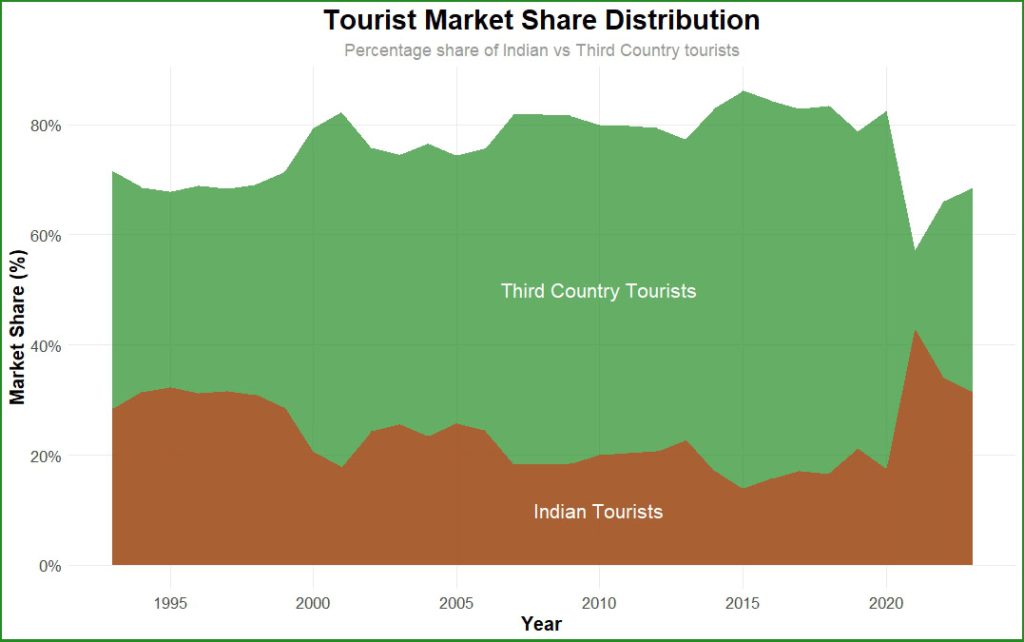
Figure 5: Tourists Market Share Comparision
4.5 Efficiency Metrics
Figure 6 compares beds per hotel, revealing a decline in average capacity per hotel, particularly for non-star establishments.
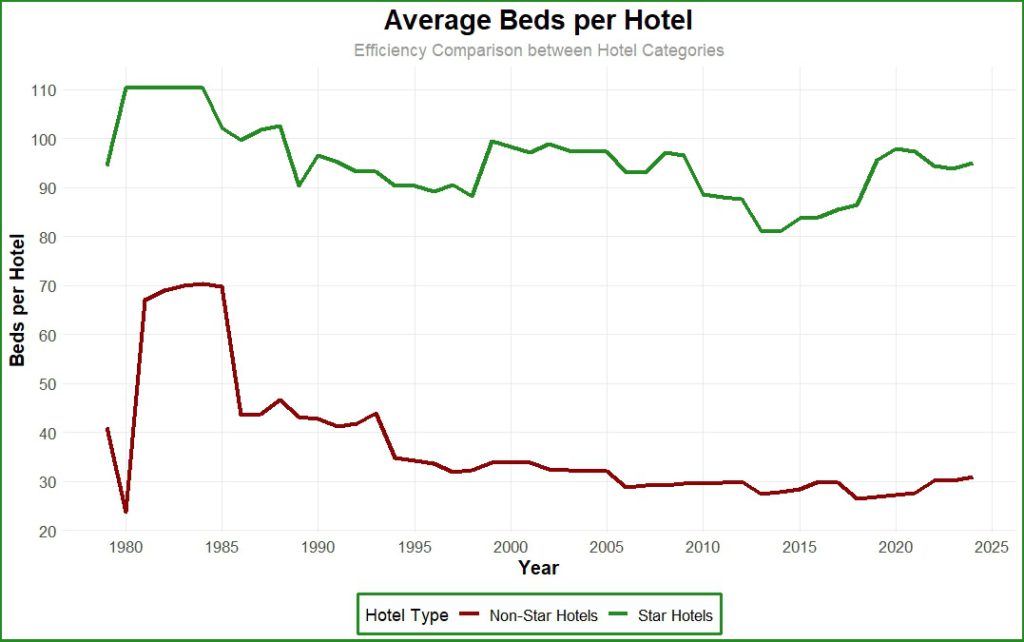
Figure 6: Average Beds Per Hotel
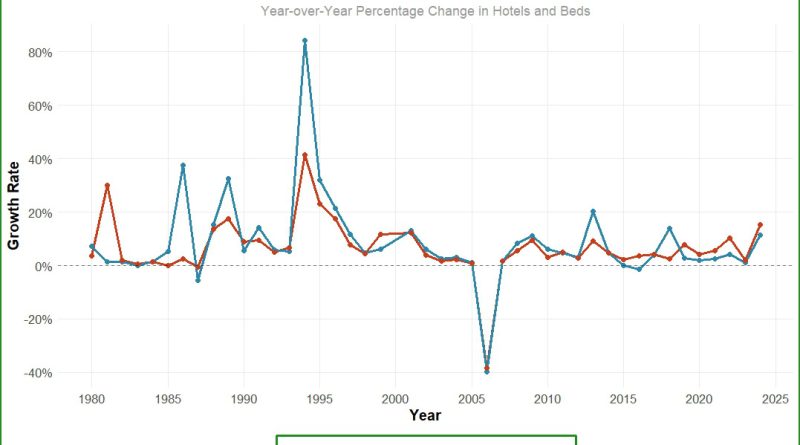
4.6 Growth Rate Analysis
The chart below depicts year-over-year growth rates for hotels and beds, with notable peaks during tourism booms and declines during disruptions.
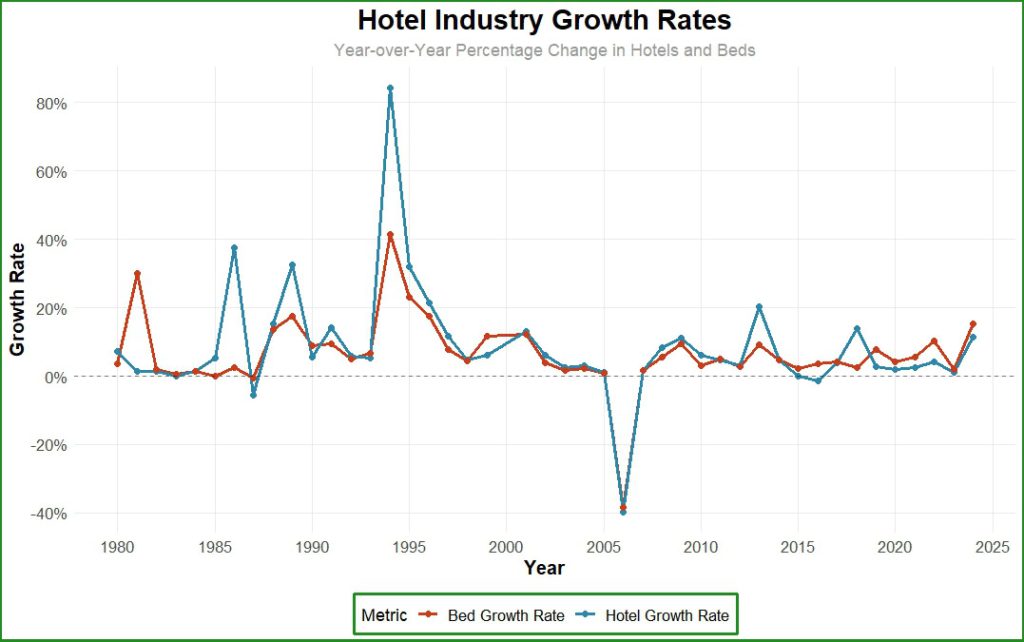
Figure 7: Hotel Industry Growth Rate
5. Discussion & Conclusion
The hotel sector in Nepal has undergone a remarkable transformation, with a 23.2-fold increase in hotels and a 12.7-fold increase in bed capacity since 1979. Non-star hotels have driven this growth, catering to diverse market segments, while star hotels maintain a premium segment. The tourism sector, despite significant disruptions (e.g., 2001 post-9/11, 2015 earthquake, 2020 COVID-19 pandemic), has shown resilience, recovering to 84.8% of its pre-COVID peak by 2023. The high volatility in arrivals (60.3% standard deviation) highlights the sector’s sensitivity to external shocks. Moderate correlations between hotel growth and tourist arrivals suggest that infrastructure expansion is partially demand-driven, with opportunities for further alignment. Strategic investments in infrastructure, targeted marketing, and risk management will be critical to sustaining this growth and ensuring long-term stability.
More From Investopaper:
Comprehensive Analysis of Tourist Arrivals and Stay Patterns in Nepal (1964-2024)
A Study on Foreign Exchange Earnings from Tourism in Nepal (1974/75 to 2023/24)