

Comprehensive Analysis of Tourist Arrivals and Stay Patterns in Nepal (1964-2024)
August 1, 2025 | Investopaper
This study provides a detailed analysis of tourist arrivals and length of stay in Nepal from 1964 to 2024, based on data from the Nepal Tourism Board. Over 60 years, tourist arrivals grew from 9,526 to 1,147,548, achieving a compound annual growth rate (CAGR) of 8.3%. Despite significant disruptions, including the civil war peak and 9/11 impact in 2001, the 2015 earthquake, and the 2020 COVID-19 pandemic, the sector recovered to 95.9% of 2019 levels by 2024. Air arrivals dominate (91.0% recent average), and the average length of stay has increased slightly to 13.3 days.
1. Introduction
Nepal’s tourism industry, a cornerstone of its economy, has evolved significantly since 1964. This study analyzes tourist arrivals, transport modes, length of stay, and growth volatility over 60 years, segmented into early tourism (1964–1980), growth period (1981–2000), modern era (2001–2019), and COVID-19 impact (2020–2024). Using advanced statistical techniques, the analysis provides insights into trends and disruptions in the Nepalese tourism sector.
2. Methodology
2.1 Data Sources
The dataset includes annual tourist arrivals (total, air, and land), average length of stay (from 1974), and growth rates from 1964 to 2024, sourced from the Nepal Tourism Board. The dataset comprises 61 observations.
2.2 Analytical Approach
The methods for analysis include:
Descriptive statistics for summary metrics,
Time-series analysis,
Visualization of trends, transport modes, and disruptions.
3. Key Findings
3.1 Overall Growth and Trends
Total Growth: Tourist arrivals grew from 9,526 in 1964 to 1,147,548 in 2024, a 11,946.5% increase (CAGR: 8.3%).
Peak Arrivals: The highest annual arrivals were 1,197,191 in 2019, with a significant drop to 230,085 in 2020 due to COVID-19.
Recovery: By 2024, arrivals reached 95.9% of 2019 levels, indicating strong post-COVID recovery.
Average Arrivals: Mean annual arrivals were 365,937, with a median of 292,995.
Table 1: Tourist Arrivals Overall Growth & Trends
| Metric | Value |
|---|---|
| Total Years | 61 |
| Minimum Arrivals | 9,388 |
| Maximum Arrivals | 1,197,191 |
| Mean Arrivals | 365,937 |
| Median Arrivals | 292,995 |
| CAGR | 8.3% |
| Average Stay (1974–2024) | 12.0 days |
| Volatile Years (>30% or <-20% Growth) | 14 |
A time-series plot (Figure 1) of total arrivals shows steady growth with notable dips in 2001, 2015, and 2020, annotated with key events (9/11, earthquake, COVID-19). A smoother line highlights long-term growth trends.
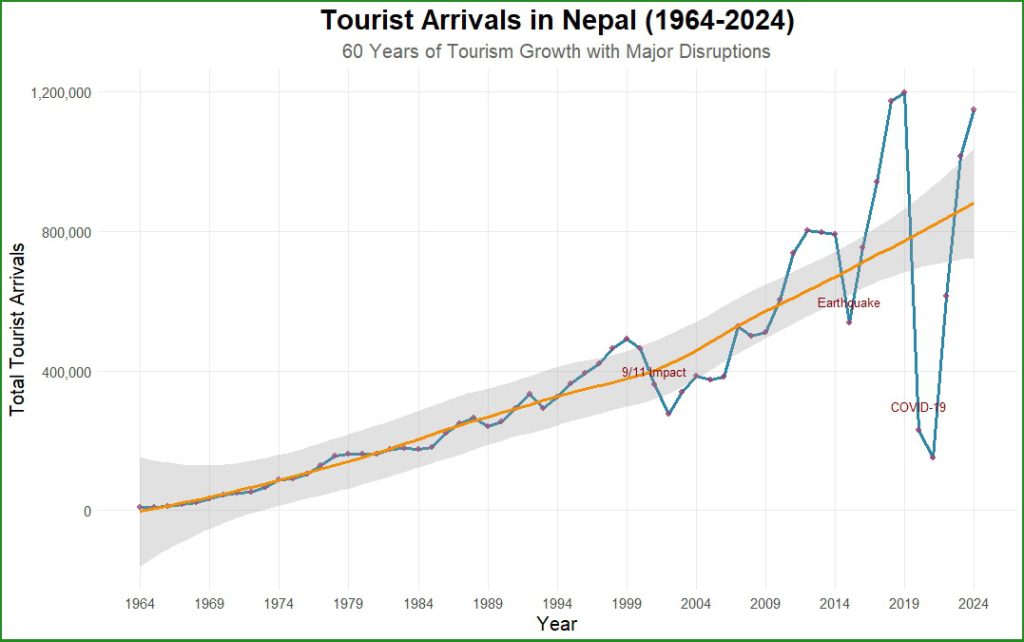
Figure 1: Tourism Arrivals in Nepal (1964–2024)
3.2 Major Disruptions
2001–2002: : Declines of -22.1% and -23.7% due to civil war peak and global security concerns post-9/11.
2007: A 37.2% surge due to improved stability.
2008: Slight decline due to Global Financial Crisis
2015: A -31.8% drop following the devastating earthquake.
2020–2022: COVID-19 caused an -80.7% drop in 2020, -34.3% in 2021, and a 307% rebound in 2022.
2023: A 65.05% increase, signaling strong recovery.
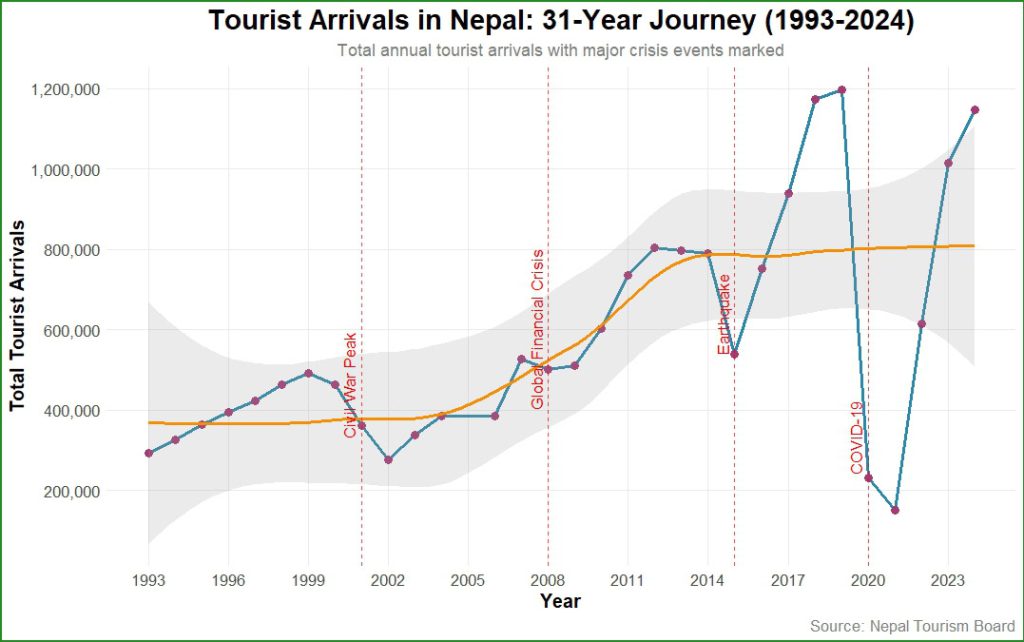
Figure 2: Tourism Growth in Nepal with Major Disruptions
Sixteen years experienced growth rates above 30% or below -20%:
Table 2: Major Disruptions in Tourist Arrivals
| Year | Total Arrivals | Growth Rate (%) |
|---|---|---|
| 1964 | 9,526 | 30.9 |
| 1966 | 12,567 | 33.9 |
| 1967 | 18,093 | 44.0 |
| 1968 | 24,209 | 33.8 |
| 1969 | 34,901 | 44.2 |
| 1970 | 45,970 | 31.7 |
| 1974 | 89,838 | 32.0 |
| 2001 | 361,237 | -22.1 |
| 2002 | 275,466 | -23.7 |
| 2007 | 526,705 | 37.2 |
| 2015 | 538,970 | -31.8 |
| 2016 | 753,002 | 39.7 |
| 2020 | 230,085 | -80.7 |
| 2021 | 150,962 | -34.3 |
| 2022 | 614,869 | 307.0 |
| 2023 | 1,014,882 | 65.05 |
A bar plot (Figure 3) of annual growth rates highlights 14 volatile years, with a smoother line indicating periods of stability and disruption.
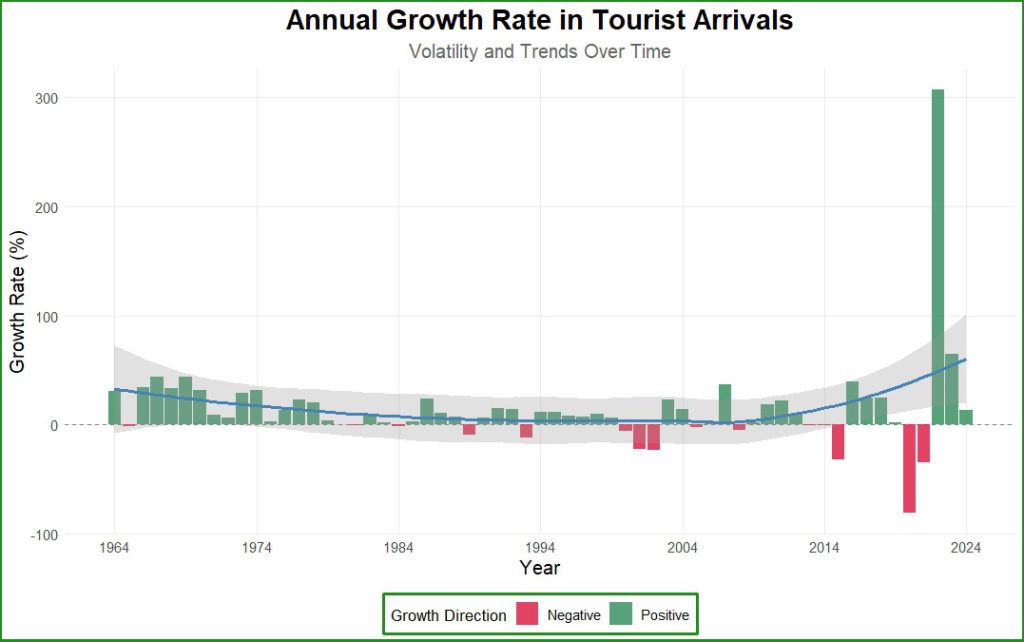
Figure 3: Annual Growth Rate in Tourist Arrival
3.3 Transport Mode Analysis
Air Dominance: Air arrivals averaged 91.0% of total arrivals in the last five years.
Land Arrivals: Land arrivals peaked in the 2000s (26.1% in 2008) but averaged 9.0% recently.
Trend: Air arrivals have grown due to improved aviation infrastructure.
Note: Data does not include of Indian tourists arrival from land route.
A stacked area plot (Figure 4) illustrates the dominance of air arrivals. A percentage distribution plot (Figure 5) shows the percentage distribution of air vs. land arrivals (blue for air and orange for land).
![]()
Figure 4: Tourism Arrivals by Mode of Transport
![]()
Figure 5: Distribution of Tourism Arrivals by Mode of Transport
3.4 Length of Stay
Average Stay: The mean stay (1974–2024) is 12.0 days, with a slight upward trend (0.030 days/year).
Recent Stay: In 2024, the average stay was 13.3 days.
Variability: Stay lengths ranged from 7.92 days (2002) to 15.5 days (2021).
A line plot (Figure 6) shows a slight upward trend in average stay, with recent years stabilizing around 13 days.
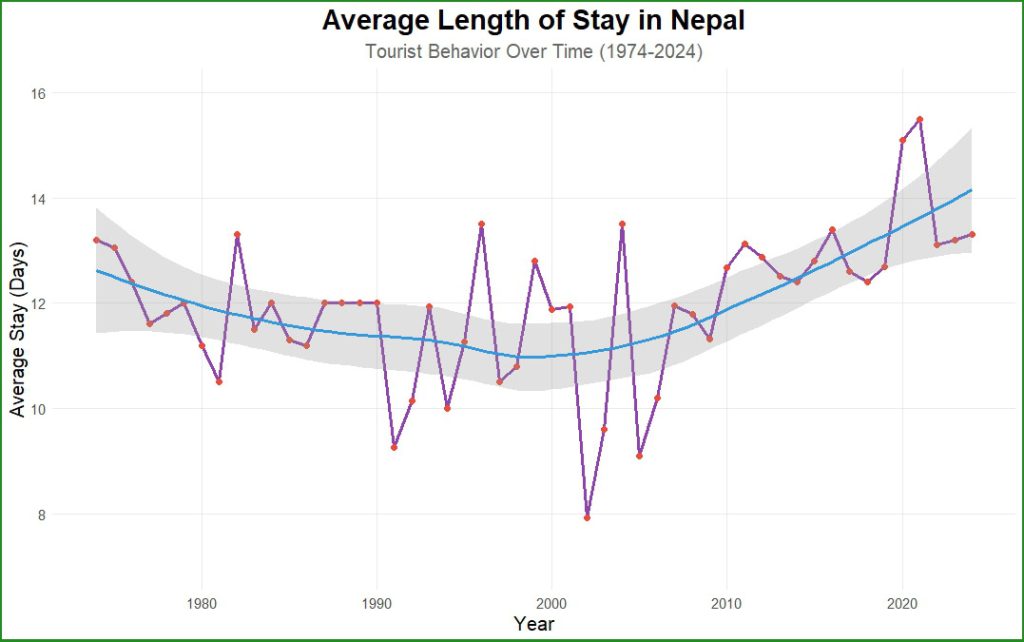
Figure 6: Average Length of Stay in Nepal
3.5 Decadal Trends
1960s: Average tourist arrivals of 18,114, high growth (30.9% average), reflecting early tourism development.
1970s: Tourist Arrivals grew to 95,198, with 17.1% average growth.
1980s: Arrivals reached 201,434, with more stable growth (4.33%).
1990s: Tourist Arrivals averaged 363,638, with moderate growth (7.7%).
2000s: Arrivals at 412,004, with high volatility (18.8% standard deviation).
2010s: Peak average arrivals (727,292), with 6.7% growth.
2020s: Arrivals at 660,901, with extreme volatility (110.0% standard deviation) due to COVID-19.
Table 4: Decadal Summary of Tourist Arrivals
| Decade | Avg. Arrivals | Avg. Growth (%) | Avg. Stay (days) | Volatility (%) |
|---|---|---|---|---|
| 1960s | 18,114 | 30.9 | – | 16.8 |
| 1970s | 95,198 | 17.1 | 12.3 | 11.5 |
| 1980s | 201,434 | 4.33 | 11.7 | 8.93 |
| 1990s | 363,638 | 7.70 | 11.2 | 7.64 |
| 2000s | 412,004 | 1.89 | 10.9 | 18.8 |
| 2010s | 833,236 | 10.7 | 12.7 | 19.9 |
| 2020s | 631,669 | 54.0 | 14.0 | 151.0 |
A bar plot (Figure 7) of average arrivals by decade underscores the 2010s as the peak period, with the 2020s showing recovery potential despite high volatility.
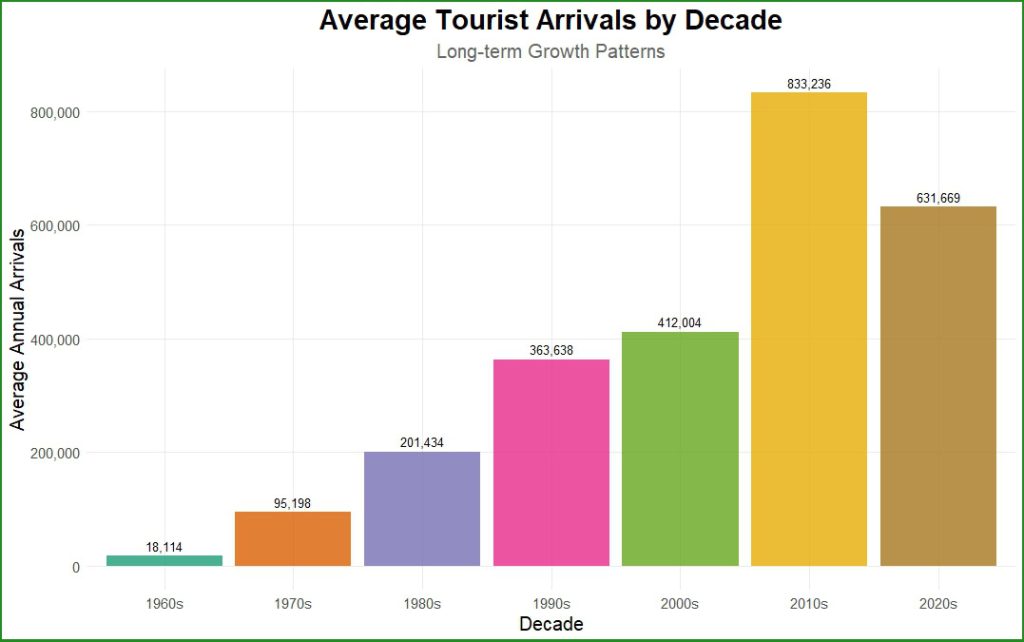
Figure 7: Average Tourists Arrival by Decade
4. Conclusion
Nepal’s tourism sector has shown remarkable growth and resilience over 60 years, overcoming major disruptions. With a CAGR of 8.3% and recovery to 95.9% of pre-COVID levels, the industry is poised for further growth. Therefore, promoting eco-friendly tourism to preserve Nepal’s natural and cultural assets is vital. Developing land border infrastructure to enhance facilities to boost regional tourism along with product diversification to encourage longer stays is recommended to maintain the growth of tourism business in Nepal going forward.