
From Scarcity to Surplus: Five Decades of Nepal’s Electricity Transformation
November 14, 2025 | Investopaper
Introduction
Nepal, endowed with vast hydropower potential (estimated at over 83,000 MW), has prioritized electricity development as a cornerstone of socioeconomic progress. However, the sector has faced hurdles including high transmission losses, import dependency, and uneven sectoral access. This study draws on annual data from fiscal years 1974/75 to 2023/24, covering consumption by end-use sectors (household, industrial, commercial, other, and exports), total supply (production + imports), losses, and peak demand.
Data Overview
The dataset comprises 50 observations, with variables measured in million kWh (except peak load in MW). Analysis employs growth metrics, trend visualizations and summary statistics to elucidate patterns.
| Variable | Description | Units | Range (Min–Max) |
| Fiscal Year | Reporting period (e.g., 1974/75) | N/A | 1974/75–2023/24 |
| Year | Calendar year for plotting | N/A | 1975–2024 |
| Household | Residential consumption | Million kWh | 54.1–4,309 |
| Industrial | Manufacturing and productive use | Million kWh | 21.4–3,694 |
| Commercial | Services and non-residential | Million kWh | 7.9–826 |
| Export | Sales to neighboring countries | Million kWh | 3.0–1,951 |
| Other | Agriculture, public lighting, etc. | Million kWh | 3.8–1,398 |
| Total | Sum of end-uses (incl. exports) | Million kWh | 91.8–12,178 |
| Power Loss | Transmission/distribution losses | Million kWh | 37.0–1,747 |
| Production + Import | Domestic generation + net imports | Million kWh | 128.8–13,728 |
| Peak Load | Maximum demand recorded | MW | 36–2,212 |
| Import | Purchases from India/others | Million kWh | 4.3–2,826 |
Overall Growth Trends
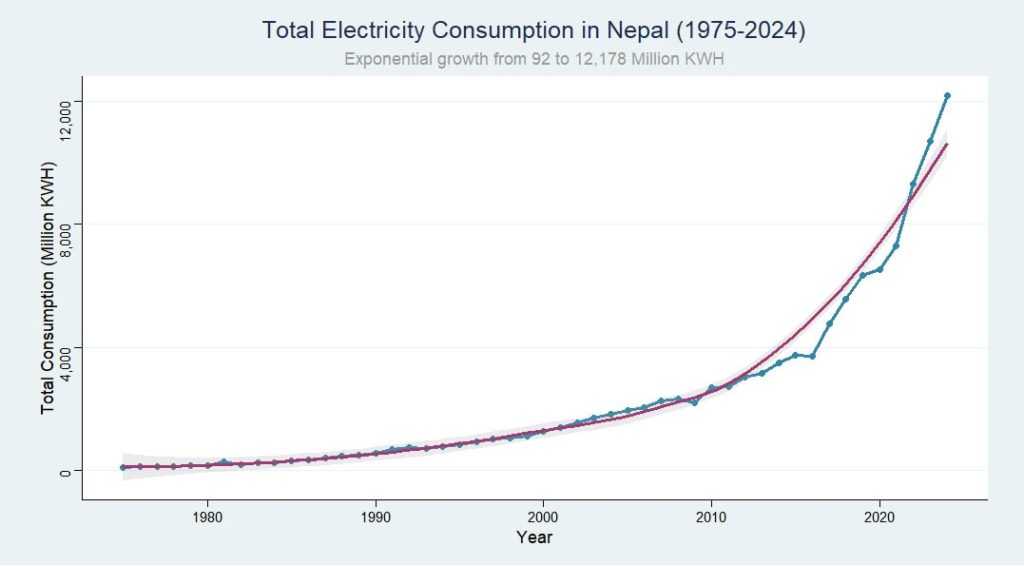
The study shows the exponential growth and profound transformation of Nepal’s electricity sector over the past 50 years. Total electricity consumption has increased by over 130-fold, from a mere 91.8 million KWH in 1974/75 to a staggering 12,178 million KWH in 2023/24. This growth has not been linear but has occurred in distinct phases, with a period of slow growth in the early years, followed by a phase of acceleration, and a recent period of rapid expansion.
Growth Phases
1974/75 – Early 1990s: Slow growth with limited electrification
Early 1990s – Early 2000s: Acceleration with hydropower development
Early 2000s – Present: Rapid expansion and export capability
Growth Metrics (1974/75–2023/24)
| Metric | Growth (%) | Multiplier | Interpretation |
| Total Consumption | 13,166 | 132.7x | Broad-based demand surge. |
| Production + Import | 10,558 | 106.6x | Supply expansion via hydropower and imports. |
| Household | 7,865 | 79.7x | Urbanization and appliance adoption. |
| Industrial | 17,162 | 172.6x | Highest growth |
| Peak Load | 6,044 | 61.4x | Demand intensity rising faster than average. |
Visualization:
Sector-Wise Consumption Analysis
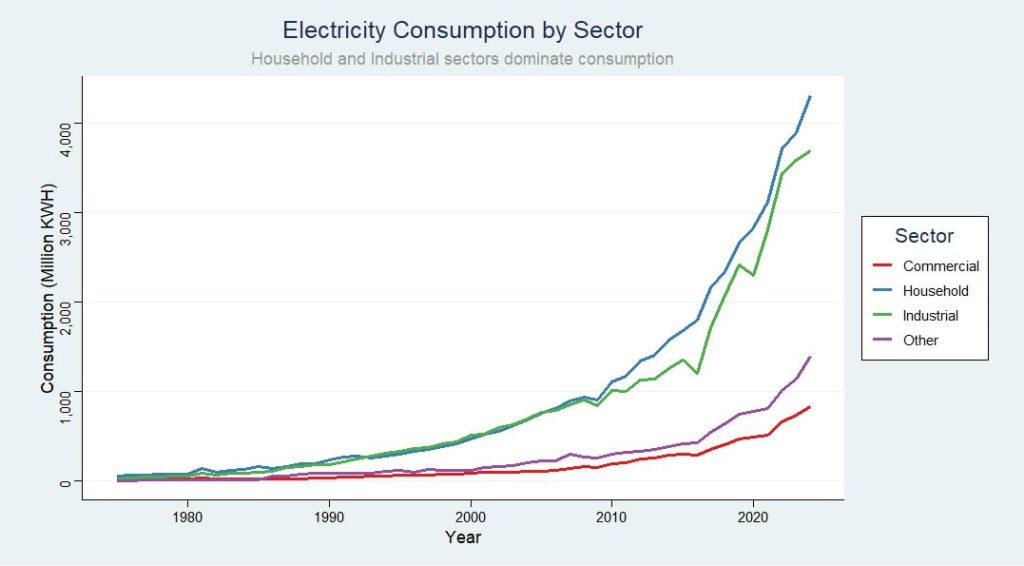
The analysis of sectoral consumption reveals that the household and industrial sectors are the dominant drivers of electricity demand in Nepal. Together, these two sectors account for the vast majority of total consumption, with their combined share consistently exceeding 60% throughout the analysis period. The household sector, in particular, has seen a significant increase in consumption, driven by factors such as urbanization, and rising incomes. The industrial sector has also experienced steady growth, reflecting the expansion of manufacturing and other economic activities. While the commercial and “other” sectors have also seen their consumption increase, their share of the total remains relatively small.
Historical Trends
Household: Steady rise from 54.1 million kWh (59% of total in 1974/75) to 4,309 million kWh, driven by rural grid extension.
Industrial: Explosive growth from 21.4 million kWh (23%) to 3,694 million kWh, peaking at 30–35% share amid manufacturing incentives.
Commercial: Modest expansion from 7.9 million kWh (9%) to 826 million kWh (~7% share).
Other: Miscellaneous uses grew from 3.8 million kWh (4%) to 1,398 million kWh (11%).
Visualization:
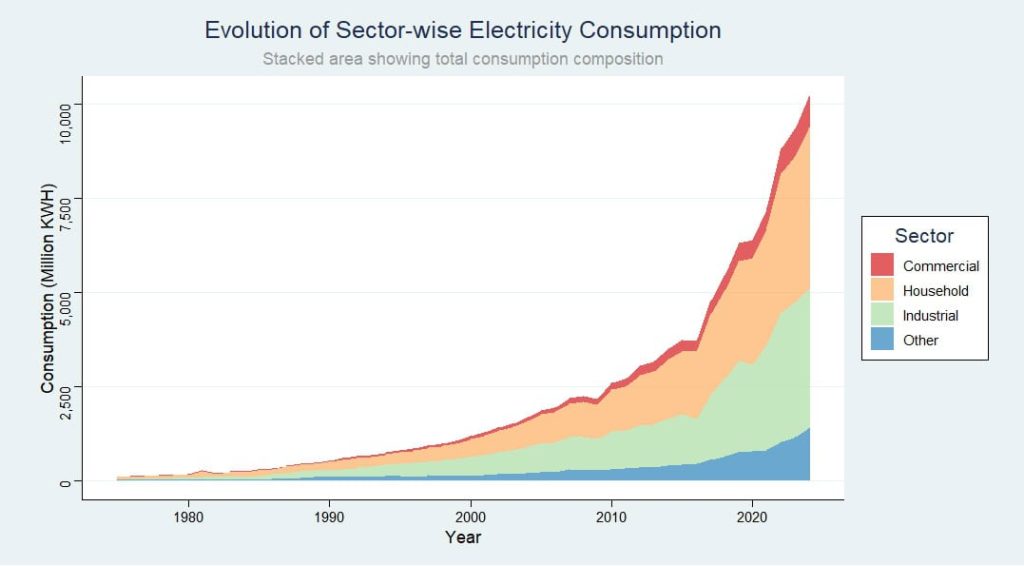
Sector Shares in 2023/24
| Sector | Consumption (Million kWh) | Share (%) |
| Household | 4,309 | 35.4 |
| Industrial | 3,694 | 30.3 |
| Commercial | 826 | 6.8 |
| Other | 1,398 | 11.5 |
| Export | 1,951 | 16 |
| Total | 12,178 | 100 |
Visualization:
System Efficiency and Losses
Despite the impressive growth in production and consumption, the study also reveals a persistent challenge in the form of system losses. Power losses, which include both technical and non-technical losses, have been a significant issue for Nepal’s electricity sector, with losses accounting for a substantial portion of total available energy. In the early years, losses were particularly high, reaching a peak of over 30% in some years.
However, the data also shows a positive trend in recent years, with the percentage of losses declining steadily to 11.3% in 2023/24. This improvement can be attributed to a range of factors, including investments in grid modernization, improved management practices, and efforts to reduce theft and other non-technical losses. While the decline in losses is a welcome development, they still remain at a level that is higher than in many other countries, indicating that there is still significant room for improvement
Average Loss (1974–2024): 25.35% of production + imports.
2023/24 Loss: 11.29% (1,550 million kWh absolute).
Minimum: 11.29% (2024), reflecting grid modernization.
Trend: Declined post-2010 from ~30% to <15%, though spikes (e.g., 34% in 2017/18) correlate with load growth.
Historical Loss Trends
![]()
Import-Export Dynamics
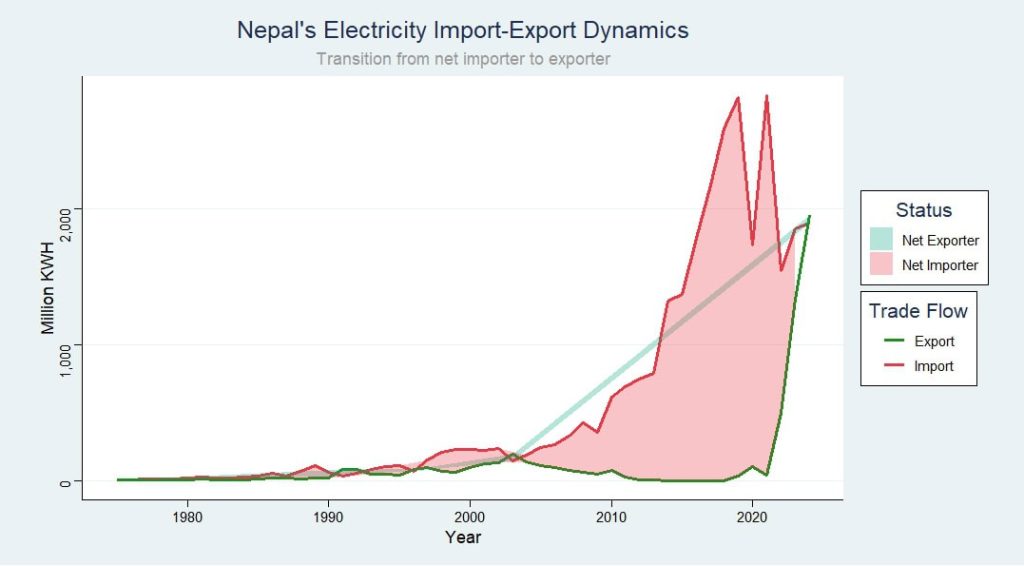
A key aspect of Nepal’s electricity sector transformation has been the dramatic shift from a position of import dependency to one of export capability. In the early years, Nepal was heavily reliant on electricity imports to meet its domestic demand, with imports accounting for a significant portion of total consumption. However, as domestic production, primarily from hydropower, has increased, the need for imports has steadily declined.
In recent years, Nepal has not only achieved self-sufficiency in electricity but has also emerged as a net exporter. This is most evident in the data for 2023/24, where exports reached a record high of 1,951 million KWH, far exceeding imports of 1,890 million KWH. This shift has significant economic and geopolitical implications, positioning Nepal as a key energy supplier in the region and providing a new source of revenue for the country.
Net Trade: Early net exporter (1974/75: +0.3 million kWh), flipped to importer mid-1990s–2010s (peak import 2,826 million kWh in 2020/21), then exporter again post-2022.
Milestone: First net exporter year: 1974/75 (exports: 4.6 million kWh).
Recent Shift: 2023/24 net exporter (+61 million kWh), with exports tripling imports.
Electricity Trade Balance Transformation
| Fiscal Year | Imports (Million KWH) | Exports (Million KWH) | Net Balance |
|---|---|---|---|
| 1974/75 | 4.3 | 4.6 | +0.3 |
| 2020/21 | 2,826.0 | 44.0 | -2,782.0 |
| 2023/24 | 1,890.0 | 1,951.0 | +61.0 |
Visualization:
Peak Load Capacity Analysis
Peak load demand, which represents the highest level of electricity demand at any given time, is a critical indicator of the capacity and reliability of an electricity system. From a modest 36 MW in 1974/75, peak load has grown to 2,212 MW in 2023/24, representing a more than 60-fold increase.
Peak demand, driven by winter dry-season shortfalls, has grown nonlinearly, straining supply.
Growth: From 36 MW (1975) to 2,212 MW (2024), 6,044% increase.
Trend: Accelerated post-2000 (average +50 MW/year recently), with loess curve projecting 2,500+ MW by 2030.
Visualization:
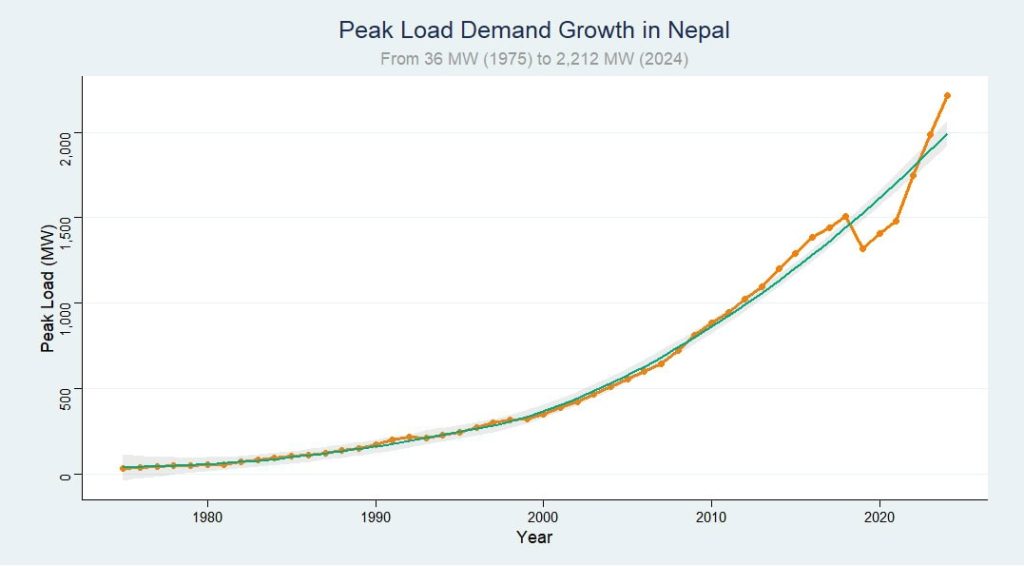
Challenge: Gap between peak (2,212 MW) and installed capacity (~2,800 MW) necessitates storage solutions like pumped hydro.
Production vs. Consumption Balance
Over the five-decade period from 1974/75 to 2023/24, the country has witnessed a dramatic increase in its electricity consumption due to expanding access to electricity. This growth in demand has been met by a corresponding increase in domestic production, which has enabled Nepal to transition from a position of import dependency to one of self-sufficiency and, more recently, to become a net exporter of electricity. This shift has been driven by a massive increase in domestic production, primarily from hydropower, which has enabled the country to meet its growing domestic demand and still have a surplus for export.
2023/24 Breakdown: Production + Import = 13,728 million kWh; Consumption = 12,178; Losses = 1,550; (Net after export embedded).
Net Production: After exports, ~11,777 million kWh available domestically.
| Fiscal Year | Production (Million KWH) | Consumption (Million KWH) | Balance |
|---|---|---|---|
| 1974/75 | 128.8 | 91.8 | +37.0 |
| 2000/01 | 1,868.4 | 1,407.1 | +461.3 |
| 2023/24 | 13,728.0 | 12,178.0 | +1,550.0 |
Visualization:
![]()
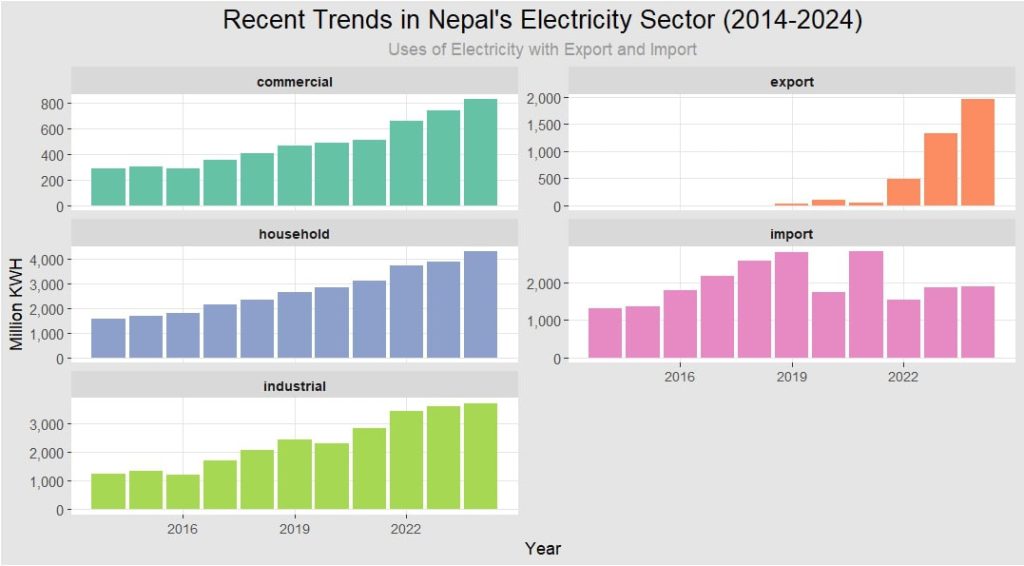
Recent Trends (2014–2024)
Focusing on the last decade reveals post-earthquake recovery and COVID resilience:
| Category | 2014 Value | 2024 Value | Growth (%) | Key Driver |
| Household | 1,679 | 4,309 | 157 | Electrification push. |
| Industrial | 1,352 | 3,694 | 173 | Industrial growth |
| Commercial | 300 | 826 | 175 | Urban services growth. |
| Import | 1,370 | 1,890 | 38 | Dry-season bridging. |
| Export | 3 | 1,951 | 65,000 | Hydropower commissioning |
Key Insights and Future Outlook
Transformation Achievements
Energy Independence: Transition from import dependency to net export position
Massive Scale-Up: 130-fold increase in total consumption over 50 years
Efficiency Gains: Loss reduction from over 30% to 11.3%
Future Challenges & Opportunities
Challenges
• Further reduction of system losses below 10%
• Managing peak demand growth (2,212 MW in 2023/24)
• Balancing seasonal production variations
• Regional grid integration complexities
Opportunities
• Expanding export markets in South Asia
• Developing pumped storage for balancing
• Attracting investment for capacity expansion
• Leveraging clean energy credentials
Conclusion
Nepal’s electricity sector transformation over the past five decades stands as a remarkable achievement in energy security and economic development. From humble beginnings of 91.8 million KWH consumption in 1974/75 to becoming a net exporter with 12,178 million KWH consumption in 2023/24, the sector exemplifies successful long-term strategic planning and execution.
On the economic front, the ability to export electricity provides a new source of revenue for the country, which can be used to fund development projects and reduce the trade deficit. The export of electricity also creates new opportunities for investment and job creation in the energy sector, as well as in related industries.
The continued focus on efficiency improvements, regional integration, and sustainable development will be crucial for maintaining this positive trajectory and realizing Nepal’s full potential.
More From Investopaper:
An Analytical Study on Electricity Demand in Nepal
Comprehensive Analysis of Tourist Arrivals and Stay Patterns in Nepal