

Performance Analysis of Hotel Index Vs. NEPSE Index (2003–2025)
June 27, 2025 | Investopaper
This report analyzes the performance of the Hotel Index, comprising hotel stocks listed on the Nepal Stock Exchange (NEPSE), against the broader NEPSE Index from July 2003 to April 2025. Using a dataset of 5,005 daily observations, we examine trends, correlations, returns, and volatility to provide insights into their relative performance.
Key findings include a strong positive correlation (0.8715) between the indices, significantly higher growth in the Hotel Index (3,178%) compared to the NEPSE Index (1,202.32%), and higher volatility in the Hotel Index’s daily returns (1.6053% vs. 1.2722%).
Data Overview
The dataset spans from July 17, 2003, to April 13, 2025, with 5,005 observations. The Hotel Index ranged from 172.25 to 7,780.667 points, while the NEPSE Index ranged from 195.14 to 3,199.026 points.
The dataset for the analysis was taken from Nepal Stock Exchange (NEPSE). Daily trading data of Nepse Index and Hotel Index were used for the purpose of the study.
Also Read:
Analysis of the Relationship Between Commercial Bank Index and NEPSE Index (2003–2025)
Major Factors Influencing The Share Market Of Nepal
Key Findings
1. Correlation and Trends
The Hotel and NEPSE indices exhibit a strong positive correlation of 0.8715, indicating that they tend to move together. A time series plot (Figure 1) illustrates their trajectories, with the Hotel Index showing more pronounced growth, particularly in recent years.
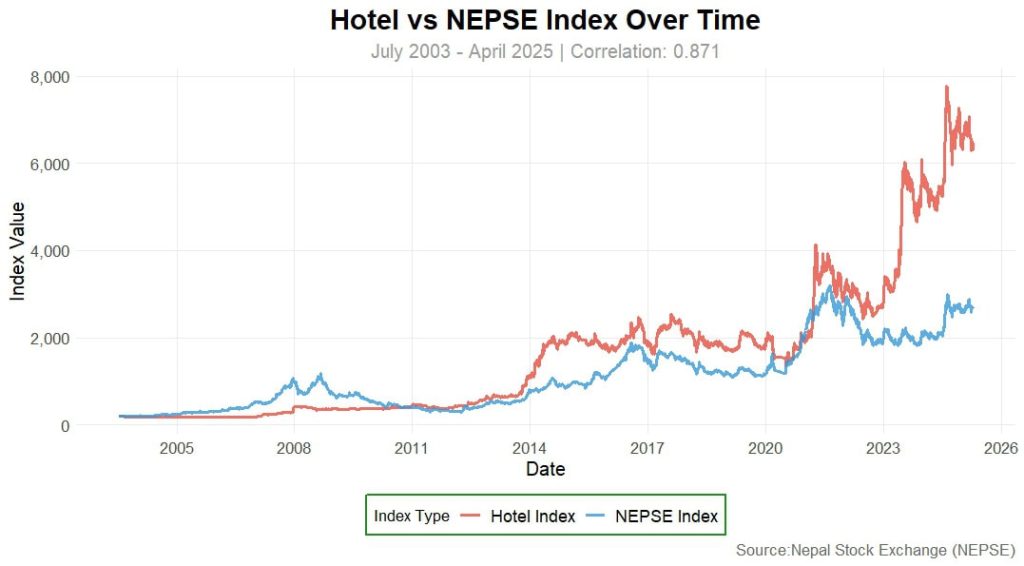
Figure 1: Time Series Plot of Hotel and NEPSE indices
The scatter plot with a trend line (Figure 2) confirms the strong positive correlation between the Nepse Index and Hotel Index.

Figure 2: Scatter Plot with Trend Line
2. Normalized Performance
To compare relative growth, both indices were normalized to a base value of 100 at the start of the period (July 2003). The normalized comparison (Figure 3) highlights the Hotel Index’s superior performance, growing to over 31 times its initial value by April 2025, compared to the NEPSE Index’s 12-fold increase. This suggests that hotel stocks have outperformed the broader market significantly over the period.
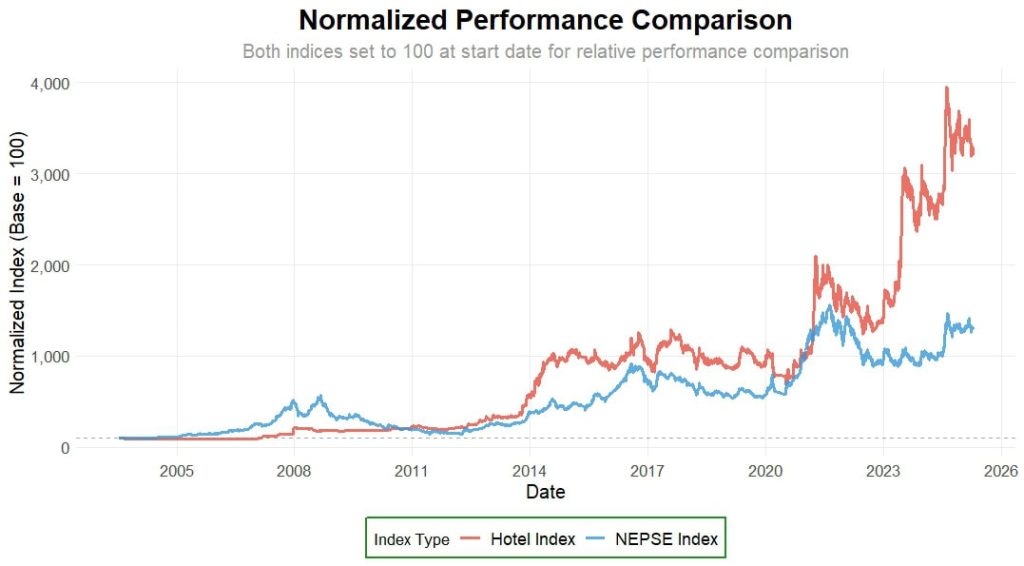
Figure 3: Normalized Performance Comparison
Suggested Readings:
Online Share Trading In Nepal: How To Buy & Sell Shares?
History Of Share Market In Nepal
3. Returns Distribution
Daily returns were calculated as percentage changes in index values. The boxplot of daily returns (Figure 4) shows that the Hotel Index has a wider range of returns, with a minimum of -8.69% and a maximum of 34.35%, compared to the NEPSE Index’s -6.97% to 6.06%. The median daily return for the Hotel Index is 0%, while the NEPSE Index has a slightly negative median (-0.0069%). The mean daily returns are 0.0823% for the Hotel Index and 0.0594% for the NEPSE Index, indicating slightly higher average returns for hotel stocks.
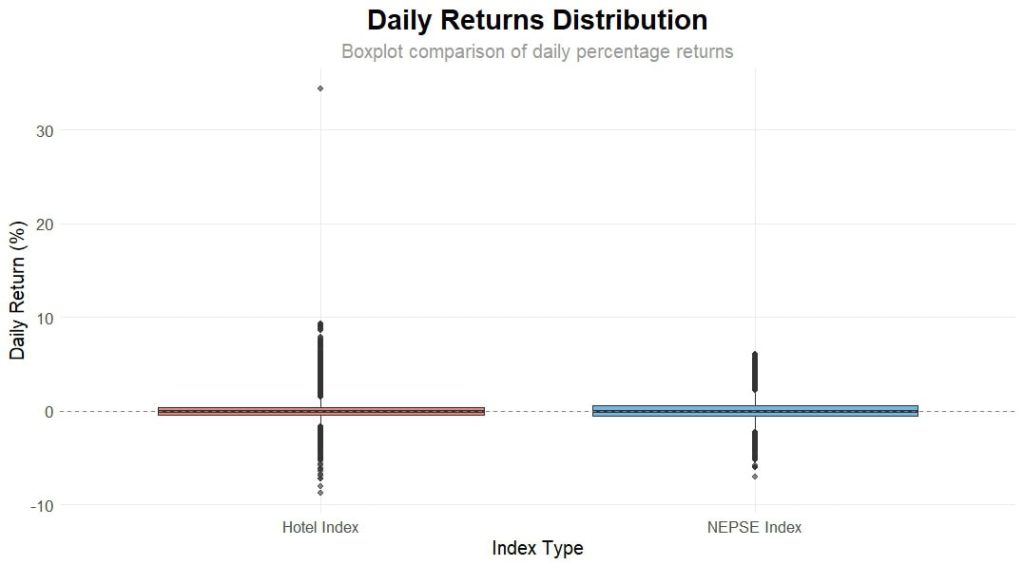
Figure 4: Daily Returns Distribution
4. Volatility Analysis
Volatility, measured as the standard deviation of daily returns over 30-day rolling windows, is higher for the Hotel Index (1.6053%) than the NEPSE Index (1.2722%). The rolling volatility plot (Figure 5) shows periods of divergence, with the Hotel Index often experiencing sharper volatility spikes, reflecting the sector’s sensitivity to economic and tourism-related factors.
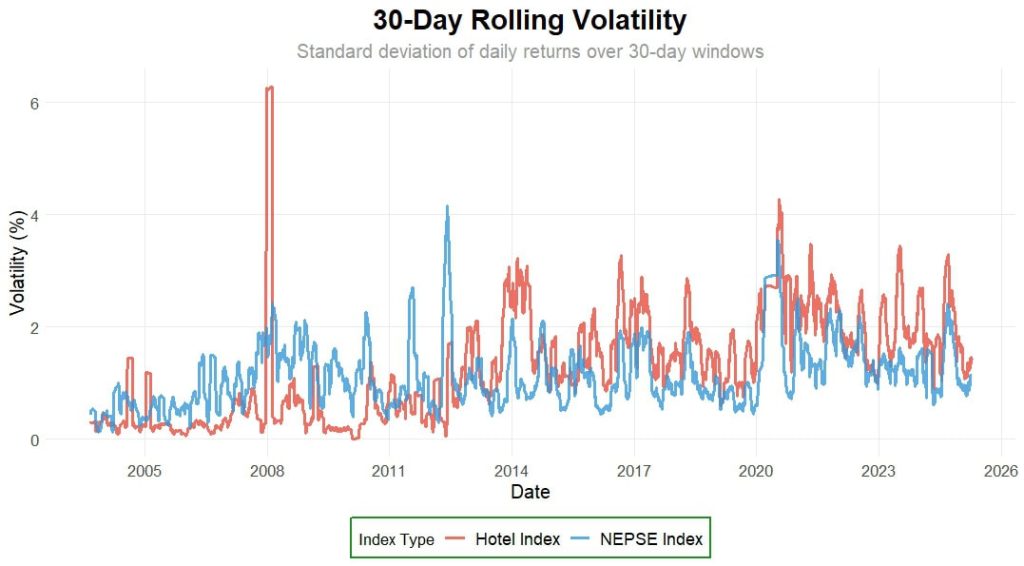
Figure 5: 30-Day Rolling Volatility
5. Rolling Correlation
The 30-day rolling correlation (Figure 5) reveals dynamic interdependence between the indices. While the correlation generally remains positive, it fluctuates between approximately 0.2 and 0.95, with occasional dips below 0.5, indicating periods where the indices moved less synchronously.
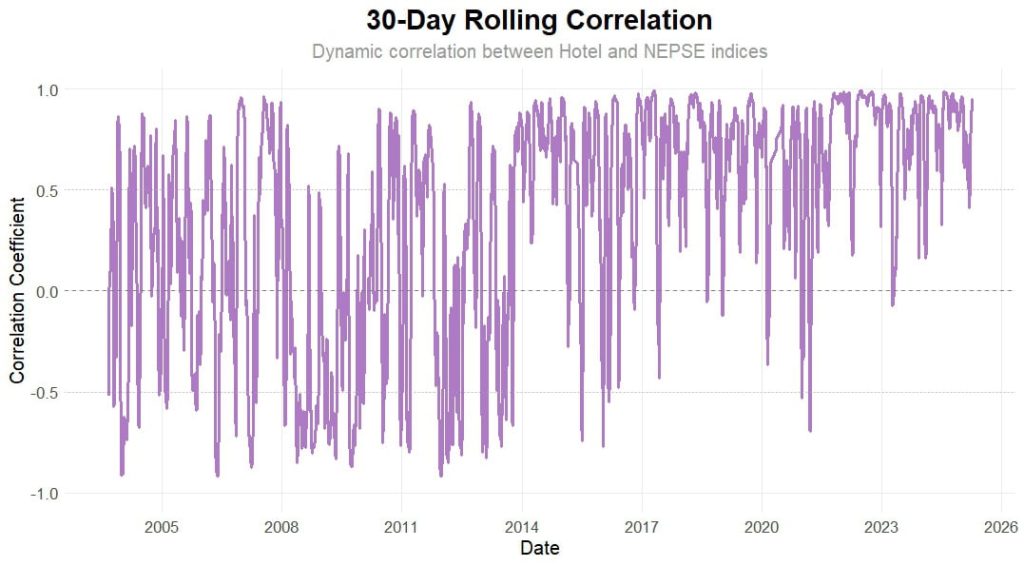
Figure 5: 30-Day Rolling Correlation
Insights and Implications
-
Superior Growth in Hotel Index: The Hotel Index’s 3,178% growth (maximum) compared to the NEPSE Index’s 1,202.32% (maximum) suggests that hotel stocks have been a high-performing sector, driven by Nepal’s growing tourism industry.
-
Higher Risk in Hotel Stocks: The higher volatility in the Hotel Index’s daily returns indicates greater risk, which investors must weigh against the potential for higher returns.
-
Strong Market Linkage: The high correlation (0.8715) suggests that hotel stocks are closely tied to overall market trends, though their outperformance indicates sector-specific drivers.
-
Investment Considerations: Investors seeking growth may find hotel stocks attractive, but the higher volatility warrants careful risk management.
Conclusion
The Hotel Index has significantly outperformed the NEPSE Index from 2003 to 2025, driven by robust growth in Nepal’s hospitality sector. However, its higher volatility indicates increased risk. The strong correlation between the indices suggests that hotel stocks are influenced by broader market trends, but their superior returns highlight sector-specific opportunities. Investors should consider these factors when evaluating hotel stocks within the Nepalese market.
More From Investopaper:
History of NEPSE: Battle Of Bulls And Bears (A Study Of 23 Years)