
A Study on Tourism-related Businesses & Guides in Nepal
September 25, 2025 | Investopaper
Introduction
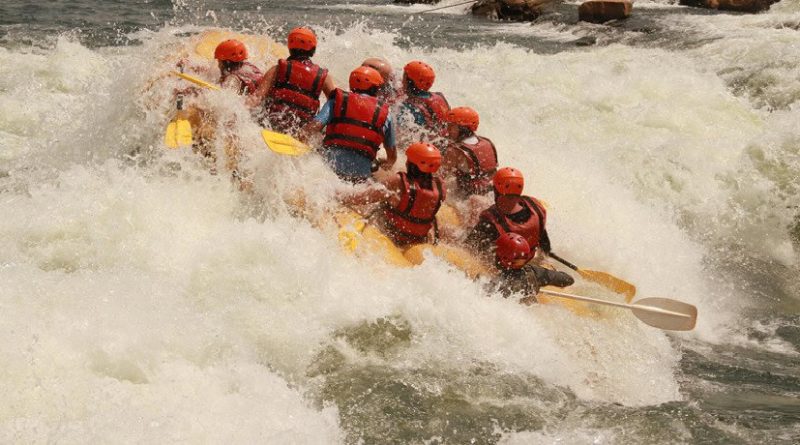
Nepal’s tourism industry is a vital component of its economy, driven by its unique geography, cultural heritage, and adventure tourism offerings. This study provides an analysis of tourism-related businesses and guides in Nepal from 2011 to 2024, focusing on key categories such as travel agencies, trekking agencies, rafting agencies, tourist transportation services, and various guide categories (tour, trekking, and river guides). Utilizing data visualization and statistical analysis, this study examines trends, annual growth, compositions and comparison of various tourism related businesses.
The industry absorbed the 2015 earthquake, the 2016 trade-blockade and the 2020-21 COVID-19 shock with only transient slowing; by 2022/23 all segments had re-established their long-run trajectory. Trekking-related supply (agencies + guides) is the dominant and fastest-growing pillar, confirming Nepal’s global positioning as a premier trekking destination.
You May Also Like:
Comprehensive Analysis of Tourist Arrivals and Stay Patterns in Nepal (1964-2024)
A Study on Foreign Exchange Earnings from Tourism in Nepal (1974/75 to 2023/24)
Data Description
The dataset spans 12 fiscal years (2011/12 to 2023/24) and includes the following variables:
-
Year: Fiscal year (e.g., 2011/12).
-
Travel Agency: Number of registered travel agencies.
-
Trekking Agency: Number of registered trekking agencies.
-
Rafting Agency: Number of registered rafting agencies.
-
Tourist Transportation Service: Number of registered transportation services.
-
Tour Guide: Number of licensed tour guides.
-
Trekking Guide: Number of licensed trekking guides.
-
River Guide: Number of licensed river guides.
Data for tour and trekking guides in 2011/12 is missing (recorded as 0), which was handled appropriately in growth rate calculations. The raw data is as follows:
| Year | Travel Agency | Trekking Agency | Rafting Agency |
Tourist Transportation Service | Tour Guide | Trekking Guide | River Guide |
| 2011/12 | 2239 | 1598 | 52 | 31 | 0 | 0 | 100 |
| 2013/14 | 2450 | 1761 | 60 | 50 | 3141 | 9741 | 131 |
| 2014/15 | 2611 | 1903 | 61 | 59 | 3335 | 10436 | 131 |
| 2015/16 | 2768 | 2019 | 66 | 67 | 3507 | 11358 | 187 |
| 2016/17 | 3444 | 2367 | 72 | 72 | 3717 | 13049 | 207 |
| 2017/18 | 3824 | 2637 | 73 | 72 | 3876 | 13831 | 230 |
| 2018/19 | 3508 | 2649 | 73 | 77 | 4126 | 16248 | 253 |
| 2019/20 | 3680 | 2764 | 81 | 82 | 4200 | 17625 | 266 |
| 2020/21 | 3743 | 2797 | 82 | 84 | 4241 | 17766 | 280 |
| 2021/22 | 3801 | 2821 | 87 | 85 | 4557 | 19166 | 324 |
| 2022/23 | 4773 | 3136 | 94 | 92 | 4975 | 25483 | 372 |
| 2023/24 | 4845 | 3191 | 94 | 112 | 5123 | 26292 | 390 |
Source: Department of Tourism
Summary Statistics
The following table summarizes key statistics for each category:
|
Category |
Mean |
Median |
SD |
Min |
Max |
|---|---|---|---|---|---|
|
Travel Agency |
3473.83 | 3594 | 838.31 | 2239 | 4845 |
|
Trekking Agency |
2470.25 | 2643 | 534.15 | 1598 | 3191 |
|
Rafting Agency |
74.58 | 73 | 13.47 | 52 | 94 |
|
Tourist Transportation |
73.58 | 74.5 | 20.82 | 31 | 112 |
|
Tour Guide |
3733.17 | 4001 | 1324.60 | 0 | 5123 |
|
Trekking Guide |
15082.92 | 15039.5 | 7152.23 | 0 | 26292 |
|
River Guide |
239.25 | 241.5 | 93.80 | 100 | 390 |
Trekking guides exhibit the highest mean and variability, reflecting their prominence in Nepal’s adventure tourism sector. Rafting agencies and tourist transportation services show lower counts but steady growth.
Related:
A Study on Tourists Arrival in Nepal by Gender (1993–2023)
Nepal’s Hotel Sector Analysis: Growth, Trends, and Disruptions
Analysis and Visualizations
Overall Trends
A line plot with a logarithmic scale visualizes the growth trends across all categories from 2011/12 to 2023/24. Trekking guides show the steepest increase, followed by tour guides and travel agencies.
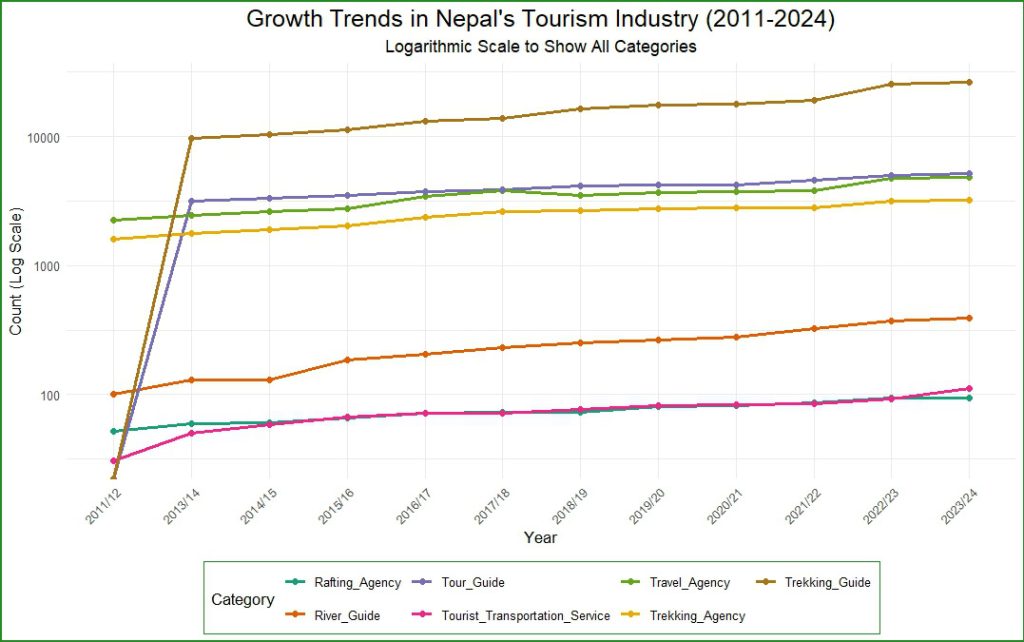
Note: Visualization uses a logarithmic scale to accommodate varying scales.
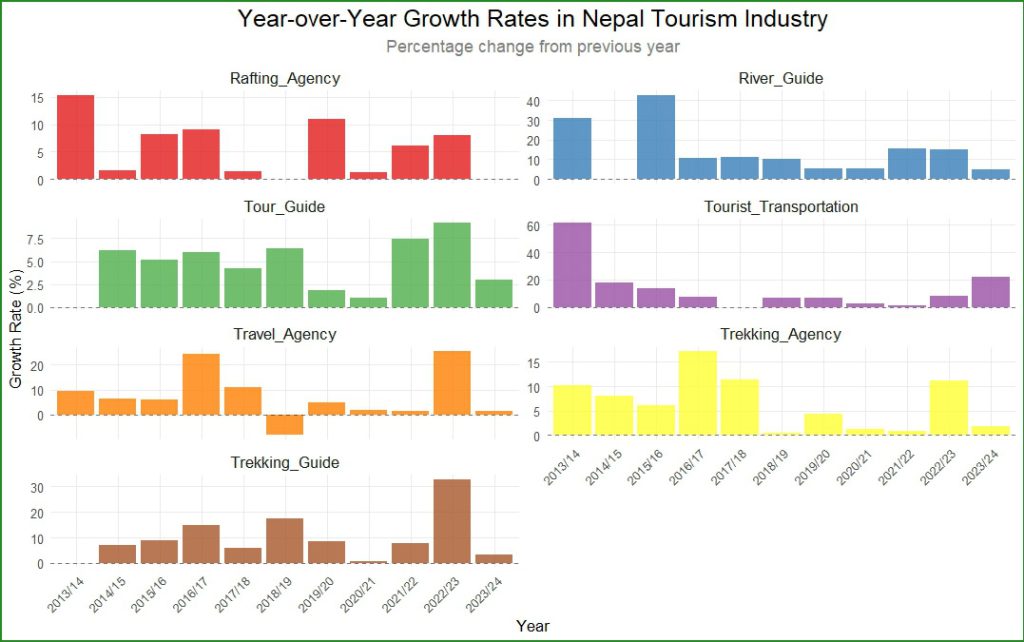
Growth Rate Analysis
A bar plot displays year-over-year growth rates. Notable changes include:
-
2016/17: Significant growth across most categories, due to post-earthquake recovery efforts.
-
2022/23: Strong growth in travel agencies (25.6%) and trekking guides (33.0%).
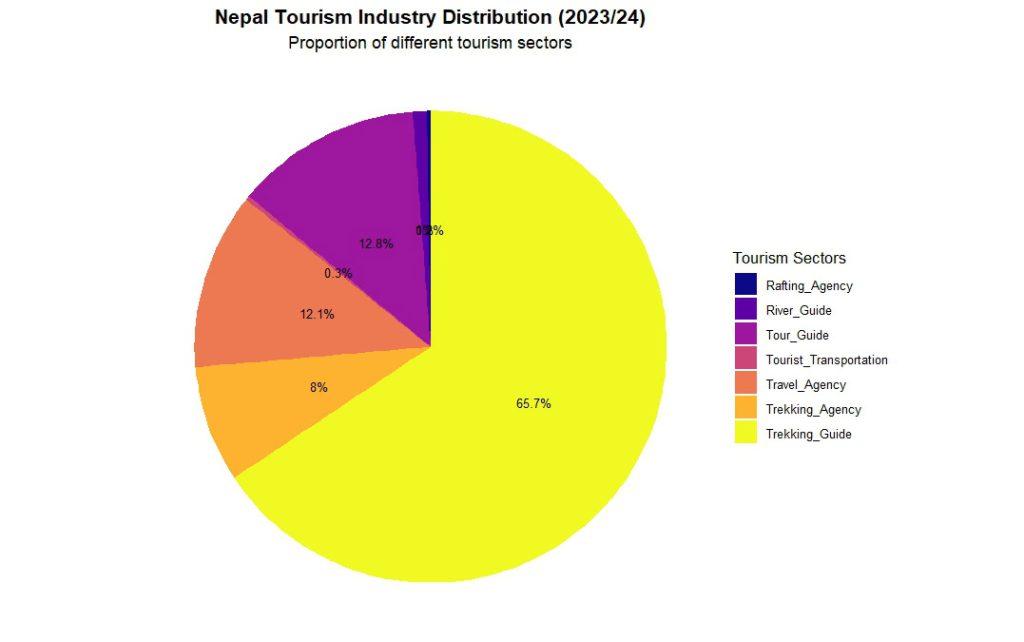
Composition of Agencies
A pie chart illustrates the composition of agencies (travel, trekking, rafting, and transportation) and various guides.
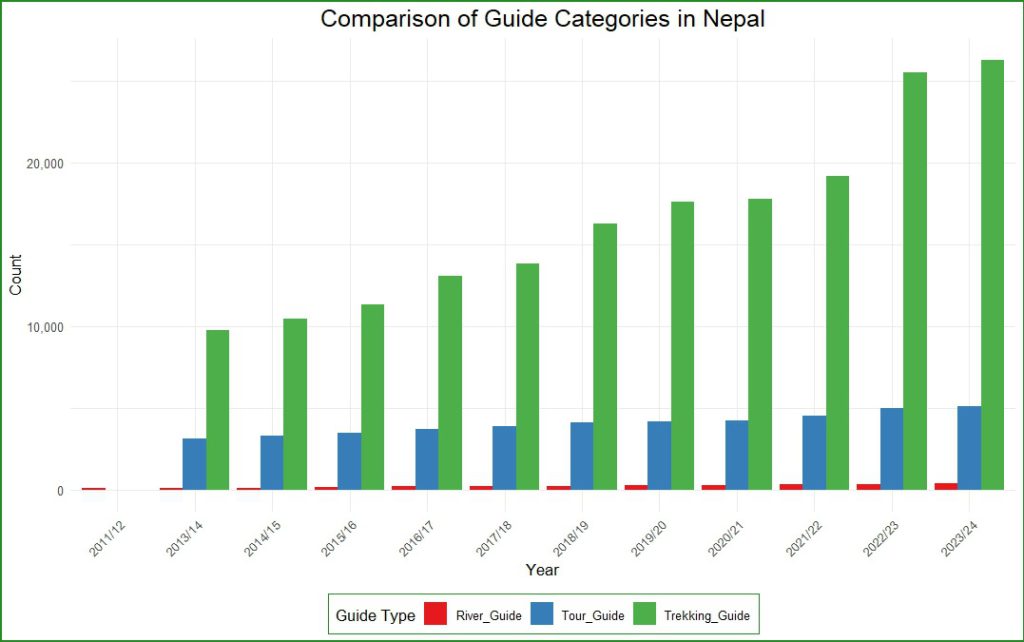
Guide Categories Comparison
A grouped bar plot compares guide categories. Trekking guides consistently outnumber tour and river guides, highlighting the dominance of trekking tourism.
Year-over-Year Changes
The following table details year-over-year changes in counts:
|
Year |
Travel Agency |
Trekking Agency |
Rafting Agency |
Transportation |
Tour Guide |
Trekking Guide |
River Guide |
|---|---|---|---|---|---|---|---|
| 2013/14 | 211 | 163 | 8 | 19 | 3141 | 9741 | 31 |
| 2014/15 | 161 | 142 | 1 | 9 | 194 | 695 | 0 |
| 2015/16 | 157 | 116 | 5 | 8 | 172 | 922 | 56 |
| 2016/17 | 676 | 348 | 6 | 5 | 210 | 1691 | 20 |
| 2017/18 | 380 | 270 | 1 | 0 | 159 | 782 | 23 |
| 2018/19 | -316 | 12 | 0 | 5 | 250 | 2417 | 23 |
| 2019/20 | 172 | 115 | 8 | 5 | 74 | 1377 | 13 |
| 2020/21 | 63 | 33 | 1 | 2 | 41 | 141 | 14 |
| 2021/22 | 58 | 24 | 5 | 1 | 316 | 1400 | 44 |
| 2022/23 | 972 | 315 | 7 | 7 | 418 | 6317 | 48 |
| 2023/24 | 72 | 55 | 0 | 20 | 148 | 809 | 18 |
Compound Annual Growth Rate (CAGR)
The CAGR for each category from 2011/12 to 2023/24 (or from the first non-zero value for tour and trekking guides) is:
|
Category |
CAGR |
|---|---|
|
Travel Agency |
7.24% |
|
Trekking Agency |
6.49% |
|
Rafting Agency |
5.53% |
|
Tourist Transportation |
12.39% |
|
Tour Guide |
5.01% |
|
Trekking Guide |
10.44% |
|
River Guide |
13.17% |
River guides and tourist transportation services show the highest CAGR, indicating rapid growth relative to their initial counts.
Market Structure Insights
Trekking cluster dominance: 26,292 trekking-guide licences vs. 5,123 tour-guide licences → 83 % of front-line human capital is mountain-trek oriented.
Rafting remains niche: Little growth since 2020/21 suggests market saturation on major rivers (Trishuli, Seti, Bhote-Koshi).
Transport services smallest but fastest-growing infrastructure segment: CAGR 12.4 %, yet only 112 licences—opportunity for organised fleet investors.
Conclusion
Nepal’s tourism industry has demonstrated robust growth and resilience from 2011/12 to 2023/24, driven by trekking and adventure tourism. Continued investment in human capital (guides), sustainable transport and quality assurance will be critical to convert this supply-side momentum into enhanced visitor experience and longer-term economic dividends. Future efforts should focus on sustaining the growth through infrastructure development, sustainable tourism practices, and targeted marketing to leverage Nepal’s unique tourism offerings.
More From Investopaper: