

A Study on Tourists Arrival in Nepal by Age Group (1993–2023)
September 19, 2025 | Investopaper
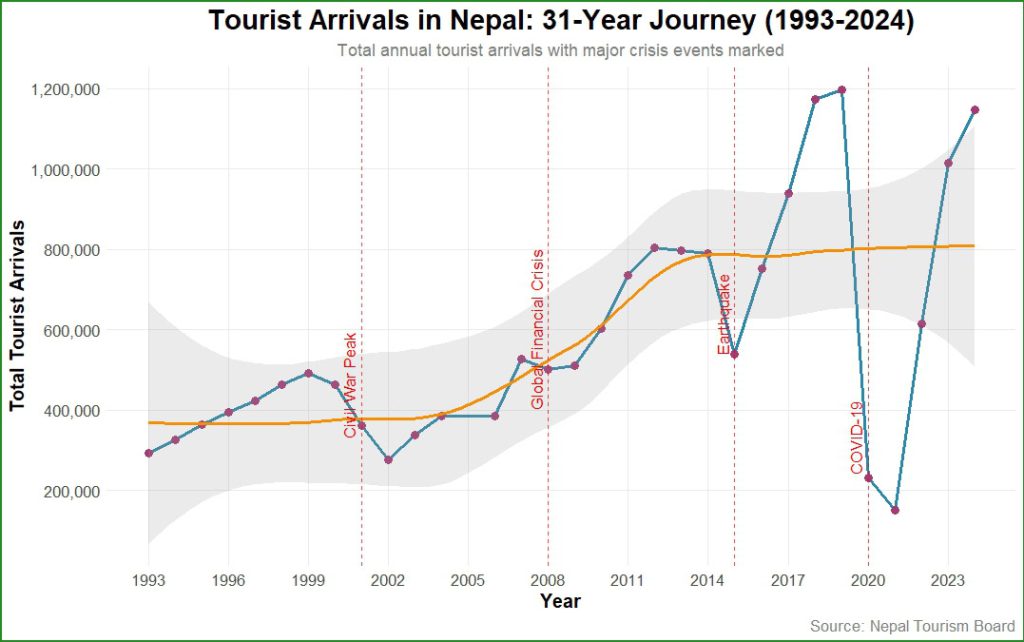
This study analyzes tourist arrival in Nepal from 1993 to 2023, focusing on age-based segmentation. The dataset reveals a general upward trend in tourism until 2019, interrupted by significant disruptions, notably the COVID-19 pandemic in 2020-2021, which caused an 80.8% drop from 2019 levels. Post-pandemic recovery is evident, with 2023 arrivals reaching 84.8% of 2019 peaks.
The 31-45 age group consistently dominates, comprising about 30.4% of arrivals on average, while the 60+ group shows the highest volatility.
Introduction
Background
Nepal’s tourism sector is a vital economic driver, attracting visitors for its natural beauty, cultural heritage, and adventure opportunities. This analysis examines annual tourist arrivals from 1993 to 2023, segmented by age groups: 0-15, 16-30, 31-45, 46-60, and 60+. The data captures long-term trends, growth patterns, and impacts from external shocks such as political instability, natural disasters, and the global pandemic.
Data Source
The dataset includes 31 years of annual figures, with total arrivals and age breakdowns. It is sourced from ‘Nepal Tourism Board’.
Data Overview
The dataset comprises 31 observations (one per year from 1993 to 2023). Key summary statistics for total arrivals and age groups are as follows:
| Variable | Min | 1st Quartile | Median | Mean | 3rd Quartile | Max | Standard Deviation |
|---|---|---|---|---|---|---|---|
| Year | 1993 | 2000 | 2008 | 2008 | 2016 | 2023 | N/A |
| Total | 150,962 | 369,397 | 491,504 | 555,399 | 744,609 | 1,197,191 | N/A |
| Age 0-15 | 9,768 | 19,856 | 30,967 | 33,270 | 41,869 | 84,891 | 17,161 |
| Age 16-30 | 30,713 | 93,436 | 120,395 | 128,259 | 163,021 | 269,648 | 57,574 |
| Age 31-45 | 64,164 | 115,993 | 150,171 | 172,125 | 215,328 | 383,155 | 81,119 |
| Age 46-60 | 35,351 | 91,686 | 121,190 | 138,531 | 180,783 | 305,651 | 71,424 |
| Age 60+ | 6,036 | 41,221 | 60,531 | 73,711 | 94,696 | 176,872 | 45,375 |
Descriptive Statistics
The following table summarizes key metrics for each age group, including Coefficient of Variation (CV) to measure relative volatility:
| Age Group | Mean | Median | SD | Min | Max | CV |
|---|---|---|---|---|---|---|
| 0-15 | 33,270 | 30,967 | 17,161 | 9,768 | 84,891 | 0.516 |
| 16-30 | 128,259 | 120,395 | 57,574 | 30,713 | 269,648 | 0.449 |
| 31-45 | 172,125 | 150,171 | 81,119 | 64,164 | 383,155 | 0.471 |
| 46-60 | 138,531 | 121,190 | 71,424 | 35,351 | 305,651 | 0.516 |
| 60+ | 73,711 | 60,531 | 45,375 | 6,036 | 176,872 | 0.616 |
The 31-45 group has the highest mean and median, indicating it as the core demographic. The 60+ group exhibits the highest CV (0.616), suggesting greater sensitivity to external factors. Younger groups (0-15 and 16-30) show lower absolute numbers but moderate volatility.
Related:
A Study on Tourists Arrival in Nepal by Gender (1993–2023)
Nepal’s Hotel Sector Analysis: Growth, Trends, and Disruptions
Trends and Visualizations
Overall Tourism Trend
Total arrivals grew from 293,567 in 1993 to a pre-COVID peak of 1,197,191 in 2019, with a compound annual growth rate (CAGR) of approximately 5.5%. The data reveals steady increases until 2019, followed by a sharp decline to 230,085 in 2020 (-80.8%) and 150,962 in 2021 (-34.4%). Recovery accelerated in 2022 (614,869, +307.3%) and 2023 (1,014,882, +65.1%).
Age Group Composition
Stacked Area Chart: Middle-aged groups (31-45 and 46-60) form the bulk, expanding proportionally over time. Youth (16-30) shows steady growth, while seniors (60+) and children (0-15) remain smaller but volatile.

Percentage Trends: Proportions stabilized post-2010, with 31-45 consistently ~30-35%. The 60+ share increased from ~10% in the 1990s to ~15% by 2019, indicating aging traveler trends.

Box Plots: The 31-45 group has the widest interquartile range, with outliers in high-growth years. The 60+ group shows the most outliers, aligning with high CV.

More From Investopaper:
Comprehensive Analysis of Tourist Arrivals and Stay Patterns in Nepal (1964-2024)
A Study on Foreign Exchange Earnings from Tourism in Nepal (1974/75 to 2023/24)