

An Analytical Study on Trekking Tourism in Nepal
October 10, 2025 | Investopaper
1. Introduction
Nepal’s trekking industry is a vital component of its tourism sector, attracting adventurers to its diverse Himalayan landscapes. This study presents a comprehensive analysis of trekking trends across Nepal’s major trekking regions from 2001 to 2023. The data reveals a robust pre-pandemic growth trajectory, a catastrophic 97.1% drop in 2020 due to the global pandemic, and an incomplete recovery by 2023 (28% of 2019 levels). Manaslu, Mustang, and Humla emerge as the top three trekking destinations by pre-COVID average volume, with Manaslu showing the most consistent growth.
2. Methodology
The analysis is based on data available in Department of Immigration from 2001 to 2023, covering 9 distinct trekking regions: Mustang, Lower Dolpa, Upper Dolpa, Humla, Manaslu, Kanchanjunga, T.Valley, Narphu, and Others.
The analysis employed descriptive statistics, trend , and visualizations:
Descriptive Statistics: Computed mean, median, standard deviation (SD), minimum, and maximum for each region (excluding zeros for accuracy). Totals, peaks, COVID impact, and recovery rates were calculated.
Visualizations:
Overall trend line.
Stacked area chart for regional distribution.
Box plots for regional distributions.
Pie charts for market share in selected years (2005, 2010, 2019, 2023).
Bar chart for year-over-year growth rates.
Line charts for top three regions.
You May Also Like:
Comprehensive Analysis of Tourist Arrivals and Stay Patterns in Nepal (1964-2024)
A Study on Foreign Exchange Earnings from Tourism in Nepal (1974/75 to 2023/24)
3. Descriptive Statistics
Total Trekkers (2001–2023):
236,714 trekkers over 23 years.
Summary Statistics by Region:
| Region | Mean | Median | SD | Min | Max |
|---|---|---|---|---|---|
| Mustang | 2005.5 | 1659 | 1440.2 | 62 | 4240 |
| Lower Dolpa | 663.7 | 739 | 362.2 | 12 | 1263 |
| Upper Dolpa | 343.5 | 338 | 310.3 | 1 | 1530 |
| Humla | 2626.7 | 1256 | 3916.9 | 22 | 13398 |
| Manaslu | 2662.5 | 2134 | 2224.4 | 360 | 7371 |
| Kanchanjunga | 578.6 | 502 | 313.4 | 55 | 1490 |
| T.Valley | 1057.8 | 1199 | 580.5 | 138 | 2030 |
| Narphu | 773.3 | 819 | 386.6 | 17 | 1291 |
| Others | 569.1 | 394 | 557.2 | 25 | 2333 |
4. Trend Analysis
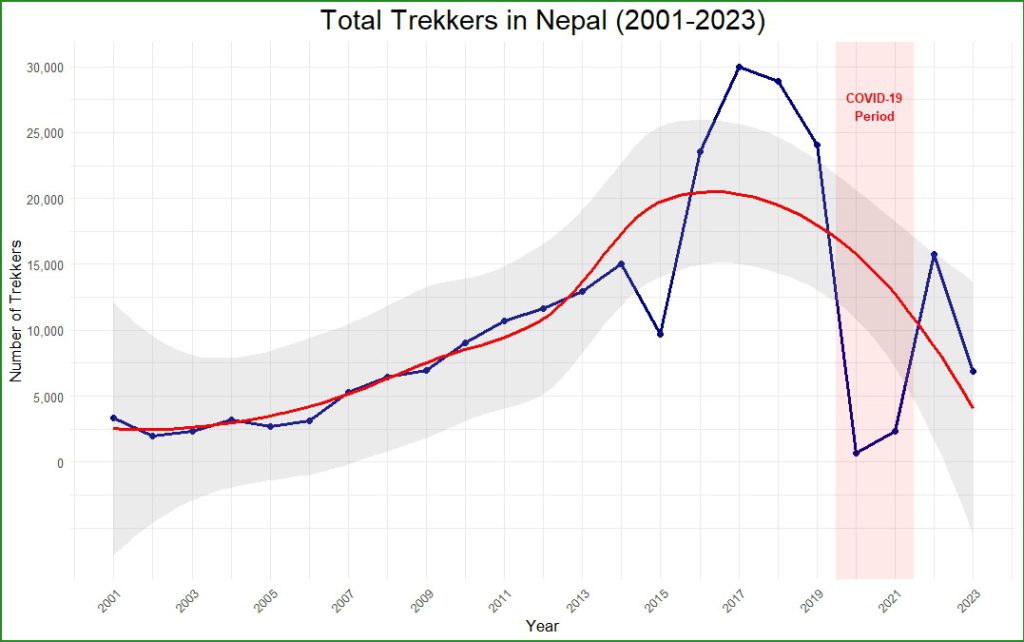
Overall Trend (2001–2023):
Trekking in Nepal exhibited strong growth from 2001 to 2019, with a compound annual growth rate (CAGR) of approximately 12.1%. Totals rose from 3,354 in 2001 to 24,079 in 2019. The COVID-19 period (2020-2021) marked a sharp decline, with only 692 trekkers in 2020. Recovery began in 2022 (15,781) and continued into 2023 (6,854), indicating resilience but incomplete rebound.
CAGR (2001–2019): ~12.1%
Peak Year (Pre-COVID): 2017 with 29,993 trekkers.
COVID-19 Impact (2020): 97.1% decrease from 2019 (24,079 → 692).
Recovery (2020–2023): 890.5% increase (692 → 6,854), but still only 28.5% of 2019 levels.
A Study on Tourists Arrival in Nepal by Gender (1993–2023)
Nepal’s Hotel Sector Analysis: Growth, Trends, and Disruptions
5. Regional Performance & Ranking
Pre-COVID Average Annual Trekkers (2001–2019):
Peak Performance by Region (Pre-COVID):
6. Visual Insights
Plot 2: Stacked Area Chart (Regional Contribution Over Time)
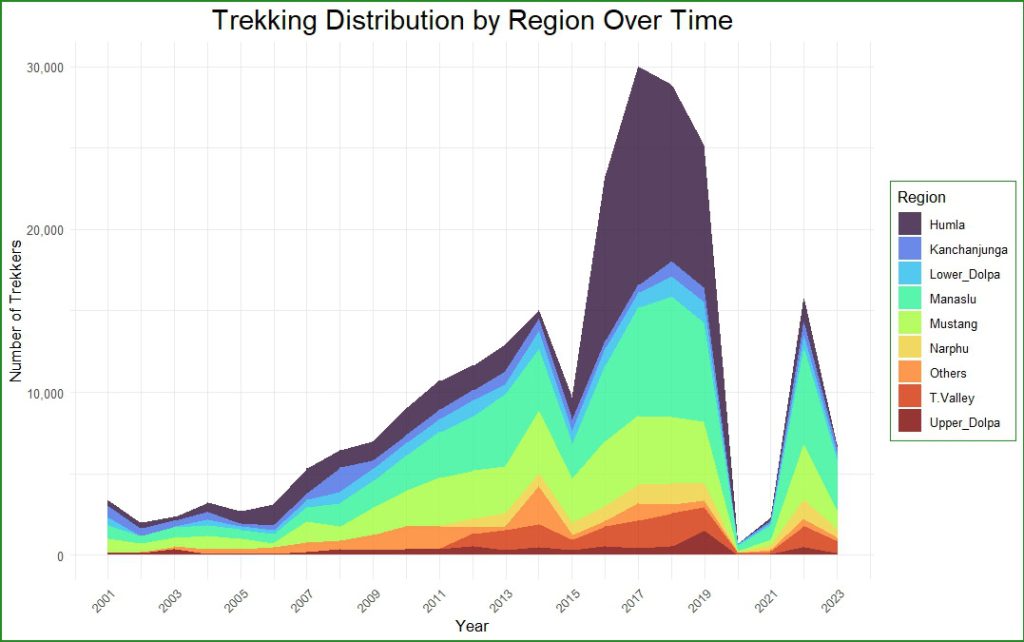
Manaslu and Mustang dominate the trekking post-2010.
Humla’s contribution is volatile — negligible in early years, dominant in 2016–2018, then collapses post-2019.
Tsum Valley and Narphu show steady growth.
Plot 3: Box Plot (Distribution)
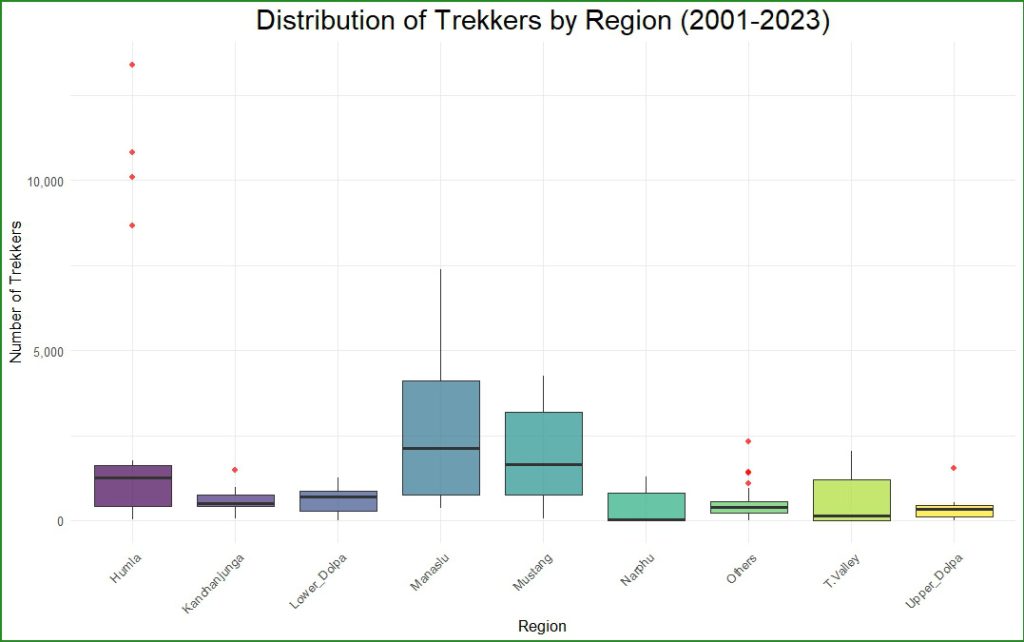
Humla has the widest IQR and most outliers — high volatility.
Manaslu and Mustang show tighter distributions — stable demand.
Tsum Valley and Narphu have low variance — emerging but predictable markets.
Plot 4: Market Share Evolution (2005, 2010, 2019, 2023)
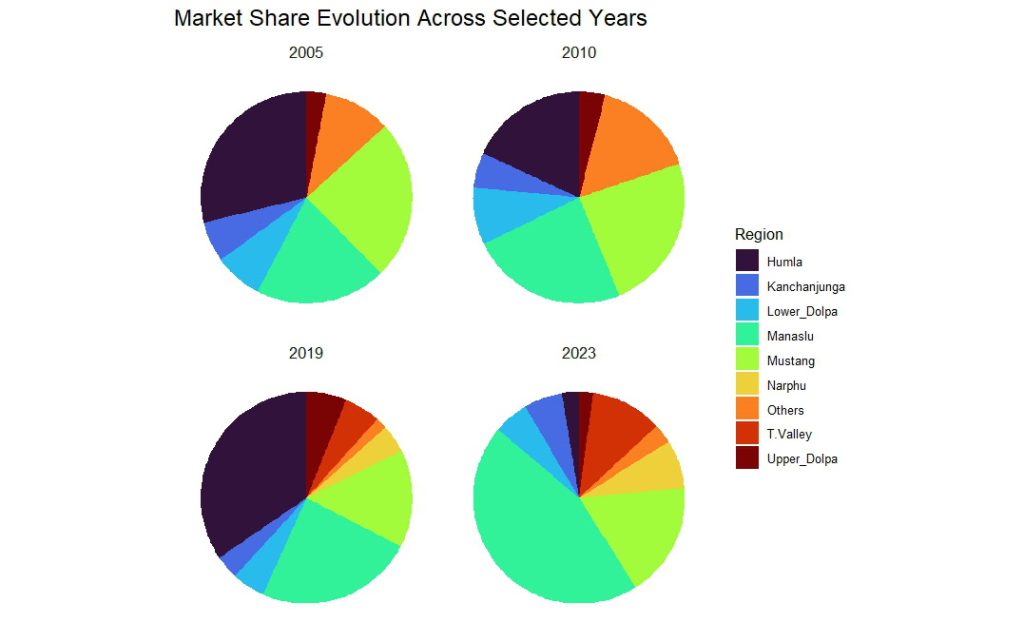
2005: Mustang and Manaslu dominate (~50% combined).
2010: Humla begins ascent; Manaslu grows.
2019: Humla peaks (36%), Manaslu (25%), Mustang (16%).
2023: Manaslu regains dominance (45%), Mustang (17%), Humla collapses to 2.6%.
Plot 5: YoY Growth Rate

Positive growth in 15 of 22 years (2002–2019).
Largest drop: -97.1% (2020).
Largest surge: +219% (2016) — driven by Humla’s explosion.
2021–2023: Consistent positive growth (recovery phase).
Plot 6: Top 3 Regions
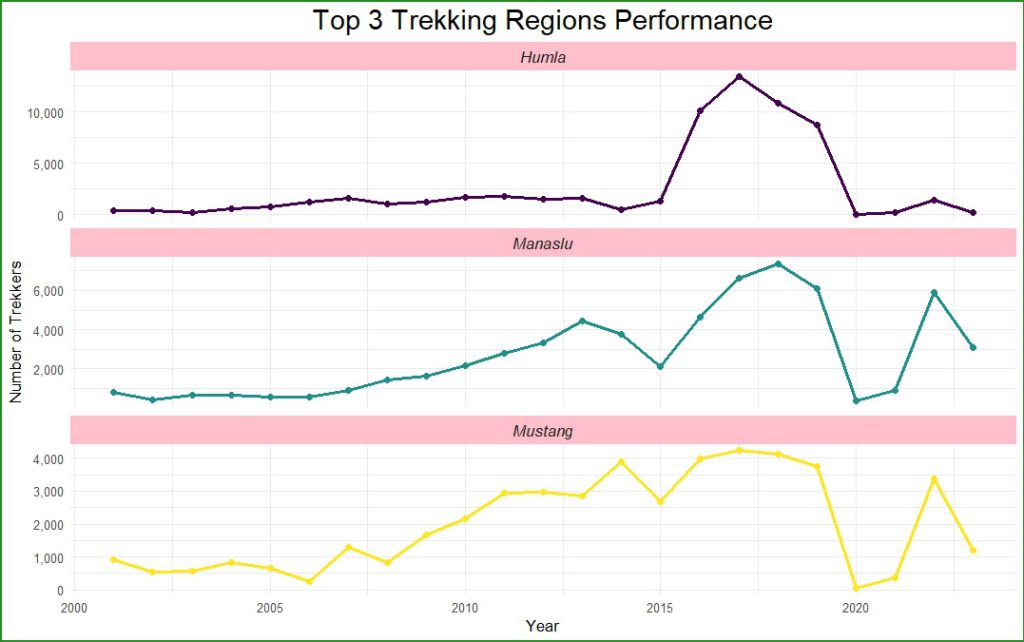
Manaslu: Steady exponential growth. Resilient post-COVID (2023: 3,094 — 51% of 2019 peak).
Mustang: Gradual growth, plateau 2016–2019. Strong 2023 rebound (1,198 — 32% of 2019).
Humla: Erratic — low until 2015, then meteoric rise and fall.
7. Key Findings
Strong pre-COVID expansion (CAGR ~12.1%), peaking in 2017. Severe pandemic disruption, with ongoing recovery at ~28% of 2019 levels by 2023.
Manaslu emerged as the top destination; Humla exhibits high volatility; Mustang offers consistency.
Upward trajectory until 2019; post-COVID recovery evident but incomplete.
8. Conclusion
Nepal’s trekking industry demonstrated remarkable resilience and growth potential, positioning the country as a global adventure tourism leader. With strategic investment, marketing, and sustainable management, Nepal can not only recover to pre-2019 levels but build a more diversified, resilient, and robust trekking economy for the future.
More From Investopaper: