
Inflation Trend in Nepal: A Study on Food Vs Non-Food Inflation
January 2, 2026 | Investopaper
This study analyzes Nepal’s Consumer Price Index (CPI) and inflation trends over 52 fiscal years from 1972/73 to 2024/25, using annual average data from the Nepal Rastra Bank (base year: 2014/15 = 100). The overall CPI index rose from 3.01 to approximately 166.23 by 2023/24.
Average annual inflation stood at 8.19% over the full period, with food and beverages driving higher volatility (mean 8.64%) compared to non-food items (7.83%). Inflation peaked in the early 1990s (up to 21%) but moderated significantly in recent decades, averaging 5.81% over the last 10 years.
The analysis draws from summary statistics, time-series trends, component comparisons, volatility measures, and period-based averages.
You May Also Like:
Inflation: Introduction, Types & Causes
Correlation Between Unemployment and Inflation
Data Overview and Summary Statistics
The dataset comprises annual CPI indices and year-over-year percentage changes for:
— Overall CPI
— Food & Beverages
—Non-Food & Services
The base year is 2014/15 (index = 100). Data spans 52 observations, with the first inflation change (1973/74) calculated relative to 1972/73.
Overall CPI Statistics (Full Period):
— Minimum index: 3.01 (1972/73)
— Maximum index: 166.23 (2023/24)
— Mean index: 49.3
— Mean annual inflation: 8.19%
— Median annual inflation: 8.11%
— Highest inflation: 21.05% (1991/92)
— Lowest: -0.69% (1975/76, mild deflation)
Mean Annual Inflation by Category (Full Period):
| Category | Mean Inflation (%) |
| Overall | 8.19 |
| Food & Beverages | 8.64 |
| Non-Food & Services | 7.83 |
Recent 10-Year Average (2014/15–2024/25):
| Category | Mean Inflation (%) |
| Overall | 5.81 |
| Food & Beverages | 5.97 |
| Non-Food & Services | 5.72 |
Recent trends show lower and more stable inflation compared to historical averages.
Recommended:
Inflation and Its Impact on Economy & Stock Market
5 Best Ways To Hedge Against Inflation
Historical Trends in CPI and Inflation
Overall CPI Index Over Time
The CPI index exhibits steady upward growth, accelerating in the 1980s–1990s and moderating post-2010. This is presented in the figure 1 and figure 2.
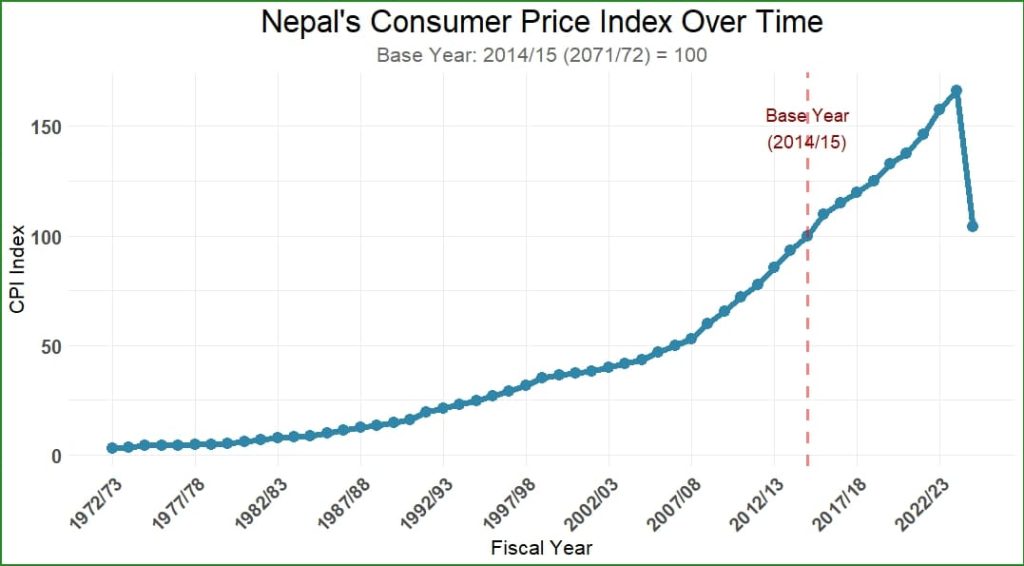
Figure 1: Consumer Price Index (CPI) of Nepal
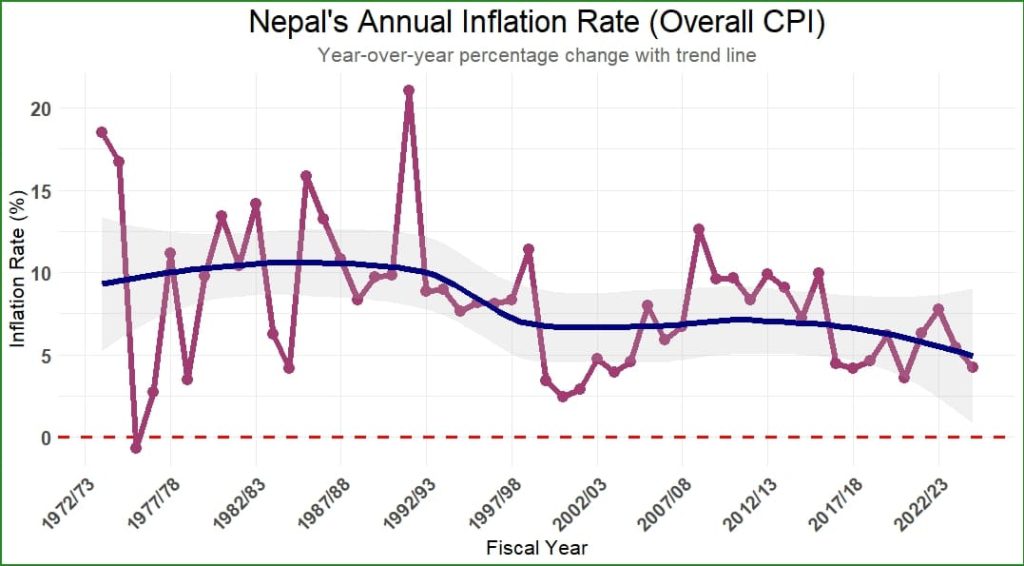
Figure 2: Annual Inflation Rate in Nepal

Figure 3: Cumulative Inflation since 2014/15
Period and Decade Analysis
| Period | Years | Avg Overall (%) | Avg Food (%) | Avg Non-Food (%) | Volatility (SD) |
| Pre-1990 | 17 | 9.88 | 10.10 | 9.69 | 5.33 |
| 1990s | 10 | 9.56 | 9.88 | 9.11 | 4.52 |
| 2000s | 10 | 6.14 | 6.99 | 5.72 | 3.19 |
| 2010s | 10 | 7.35 | 8.02 | 6.78 | 2.34 |
| 2020s | 5 | 5.47 | 5.81 | 5.26 | 1.65 |
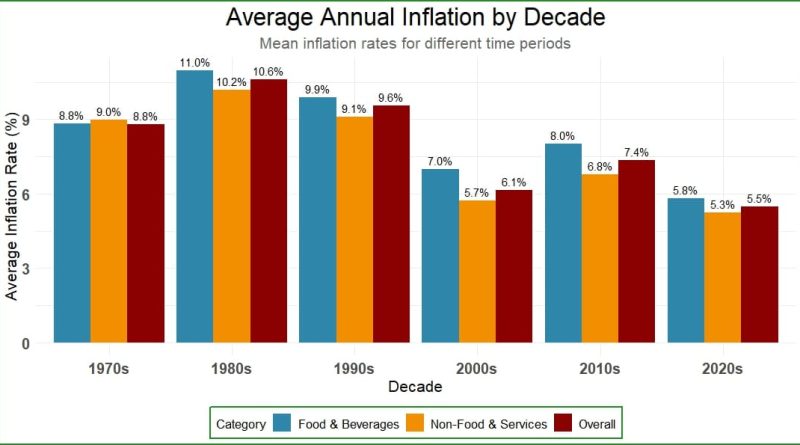
Inflation and volatility have trended downward since the 1990s, coinciding with economic liberalization, improved monetary policy, and greater integration with India (whose inflation influences Nepal via the pegged currency).
The average annual inflation by decade is presented in the figure 4.
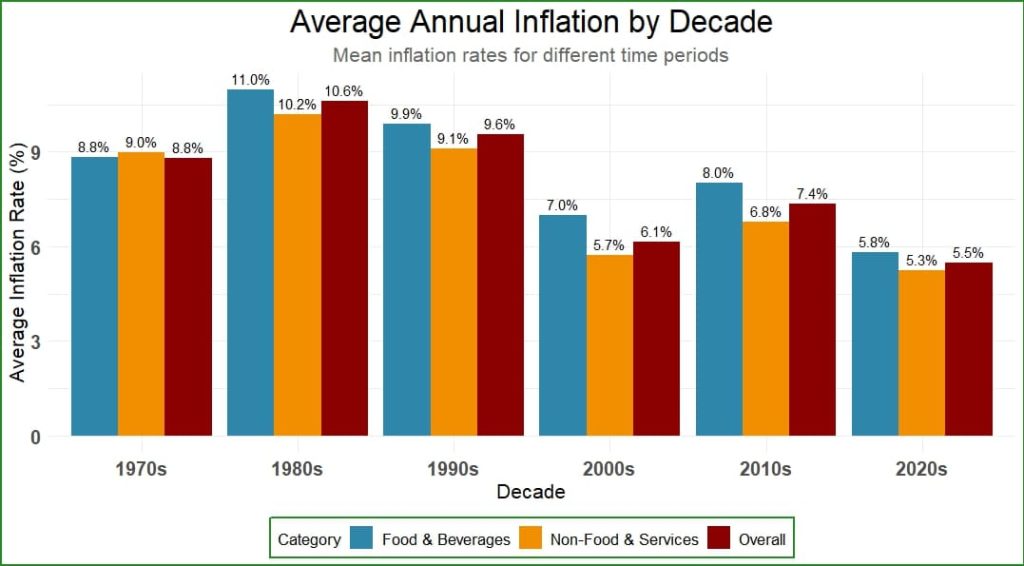
Figure 4: Average Annual Inflation by Decade
Highest and Lowest Inflation Years
Inflation rates fluctuate significantly, with double-digit spikes in the 1970s, 1980s, and early 1990s, followed by lower volatility.
Highest Inflation Years:
| Fiscal Year | Overall (%) | Food (%) | Non-Food (%) |
| 1991/92 | 21.05 | 24.52 | 14.79 |
| 1973/74 | 18.49 | 22.26 | 10.00 |
| 1974/75 | 16.73 | 15.74 | 18.99 |
| 1985/86 | 15.84 | 18.63 | 10.76 |
| 1982/83 | 14.17 | 16.01 | 10.60 |
Lowest Inflation Years (including deflation):
| Fiscal Year | Overall (%) | Food & Bev (%) | Non-Food (%) |
| 1975/76 | -0.69 | -4.09 | 7.27 |
| 2000/01 | 2.43 | -2.27 | 8.08 |
| 1976/77 | 2.70 | -0.26 | 7.06 |
| 2001/02 | 2.89 | 3.64 | 2.12 |
| 1999/00 | 3.39 | 0.46 | 7.07 |
Key Insights
Component Analysis: Food & Beverages vs Non-Food & Services
Mean differential (Food minus Non-Food) → +0.81%
Food inflation is higher in 29 out of 51 years. This indicates structural vulnerability to food supply shocks (monsoons, imports from India).
Food inflation consistently drives overall inflation, often exceeding non-food due to supply shocks, monsoon variability, and import dependence.
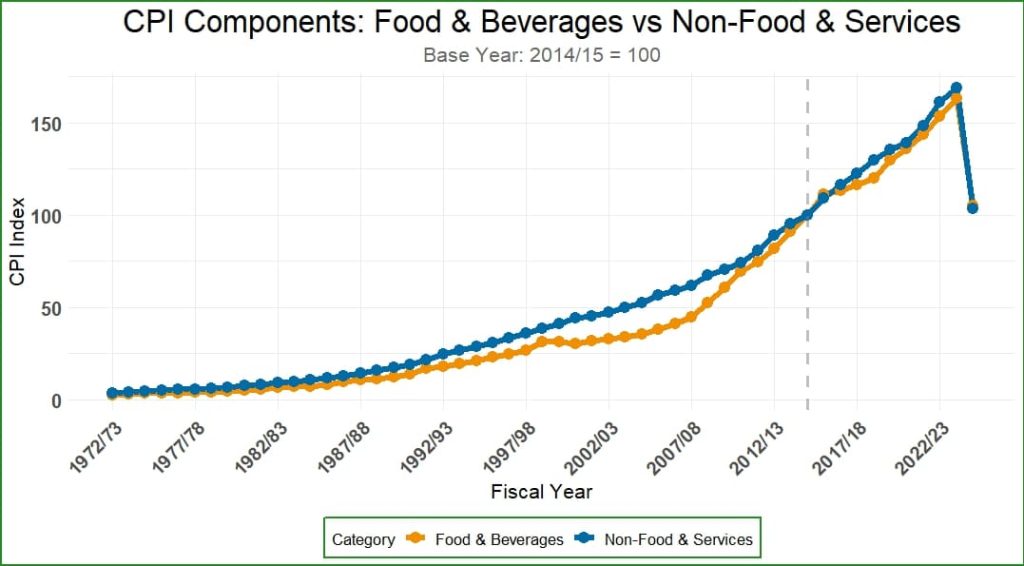
Figure 5: Food Vs Non-Food Inflation Index
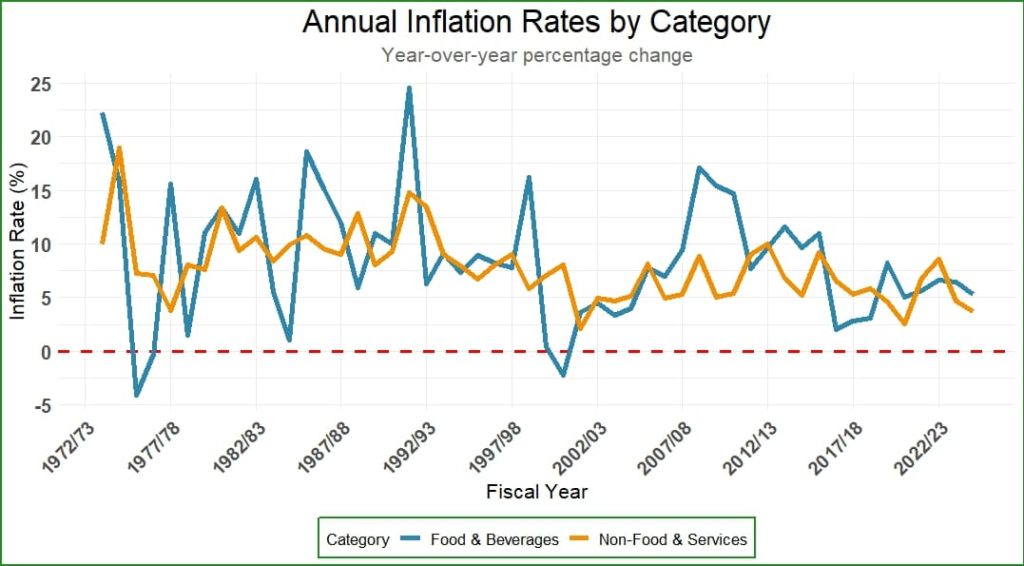
Figure 6: Annual Inflation Rates by Category
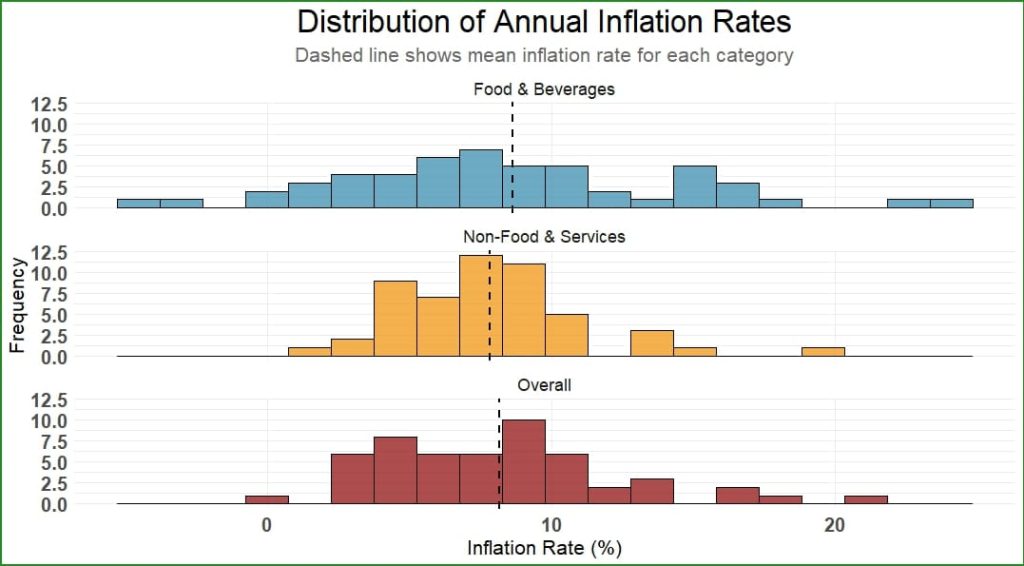
Figure 7: Distribution of Annual Inflation Rates
Correlation Analysis
Correlation between Food & Non-Food inflation is 0.382 (moderate positive). This suggests some common drivers (e.g., fuel costs, wages) but food remains more independent and volatile.
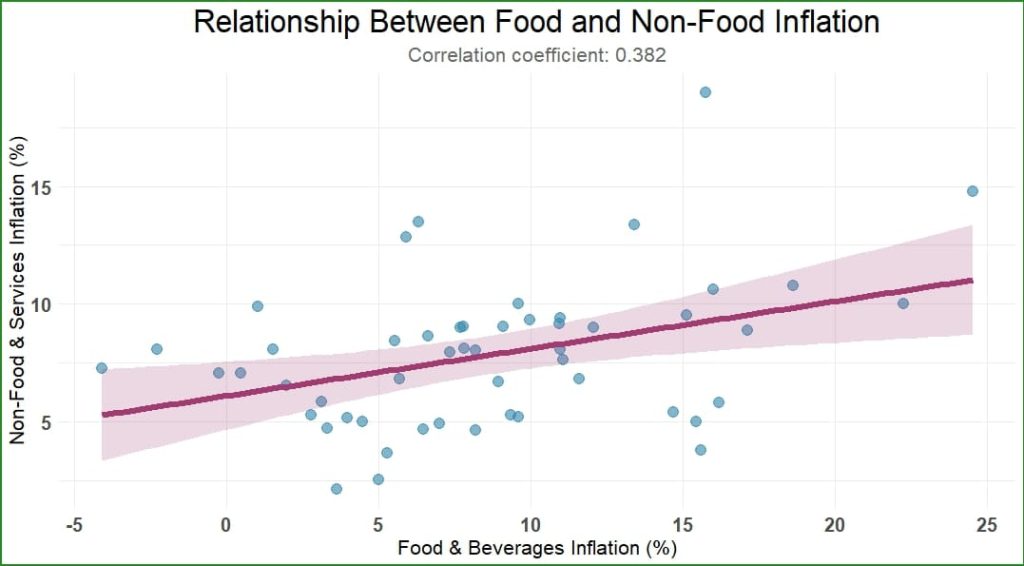
Figure 8: Correlation Between Food and Non-Food Inflation
Volatility Trends
5-year rolling standard deviation shows declining volatility, especially post-2010, reflecting better macroeconomic stability.
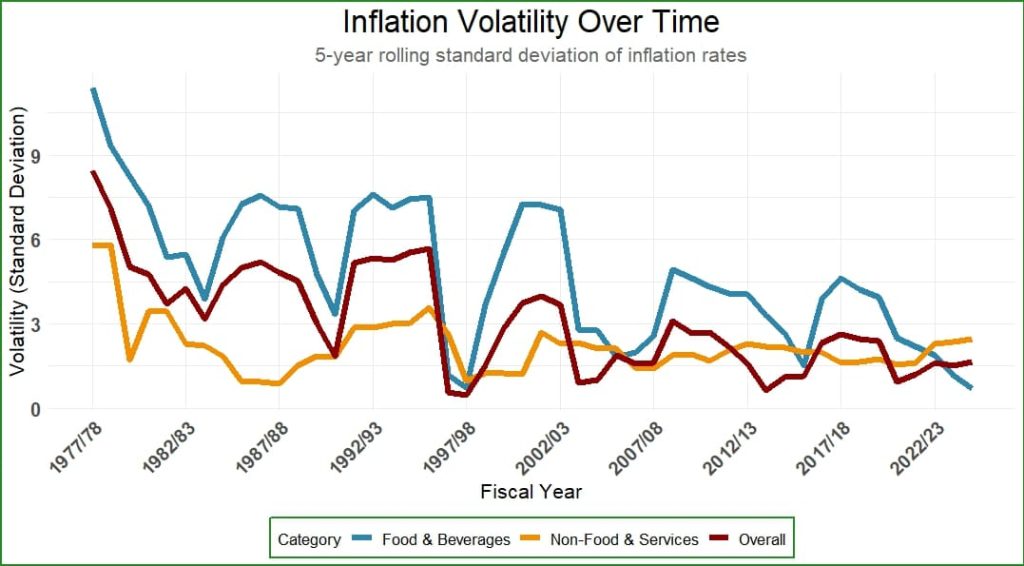
Figure 9: Inflation Volatility Over Time
Recent Trends (2019/20–2024/25)
| Fiscal Year | Overall (%) | Food (%) | Non-Food (%) |
|---|---|---|---|
| 2019/20 | 6.16 | 8.18 | 4.62 |
| 2020/21 | 3.60 | 5.01 | 2.51 |
| 2021/22 | 6.32 | 5.69 | 6.83 |
| 2022/23 | 7.74 | 6.62 | 8.62 |
| 2023/24 | 5.45 | 6.48 | 4.65 |
| 2024/25 | 4.24 | 5.27 | 3.67 |
Conclusion and Key Findings
Nepal sustains high single-digit inflation historically (average ~8%), with episodes of double-digit spikes linked to political transitions, oil shocks, and supply disruptions. Being an import dependent economy with India, the inflation in Nepal closely follows inflation in India. Since the 2010s, inflation has stabilized around 5–7%, reflecting better monetary policy by Nepal Rastra Bank, fiscal discipline, and remittances. Food remains the primary driver of inflation.
Key findings:
Average annual inflation over the full period stands at 8.19%, driven higher by food & beverages (8.64%) than non-food (7.83%).
Inflation peaks in the early 1990s (up to 21.05% in 1991/92) and moderates in recent decades.
The last 10 years (2014/15–2024/25) show relatively stable inflation averaging 5.81%, indicating improved macroeconomic stability.
Food inflation exceeds non-food in most years (29 out of 52), with moderate correlation (0.382) between the two.
Cumulative inflation since the base year reaches approximately 66% overall by 2023/24.
More From Investopaper:
Comprehensive Study on Interest Rate in Nepal: Structure, Trends, & Volatility
From Scarcity to Surplus: Five Decades of Nepal’s Electricity Transformation


