

An Analytical Study on Electricity Demand in Nepal
October 31, 2025 | Investopaper
The demand of electricity in Nepal, as reported by the Nepal Electricity Authority, has exhibited robust growth over the fiscal years 2016/17 to 2024/25. Total annual demand has more than doubled, rising from 7.06 TWh in 2016/17 to 14.11 TWh in 2024/25, driven by economic expansion, increasing electrification and exports.
This study report provides a comprehensive breakdown of trends, supported by visualizations, statistical summaries, and projections.
Data Description
The dataset (sourced from Nepal Electricity Authority) comprises monthly electricity demand (in MWh) for Nepal from fiscal year 2016/17 to 2024/25, covering 9 years and 108 observations (12 months per year). Fiscal years run from mid-July to mid-July, with months labeled August through July. Demand is aggregated at the national level by the Nepal Electricity Authority.
Time Series Analysis
The time series plot reveals a consistent upward trajectory in monthly demand, superimposed with clear seasonal oscillations. From August 2016 to July 2025, demand escalates from approximately 550 GWh to over 1,400 GWh, with a trend line confirming non-linear acceleration post-2020. Seasonal peaks align with monsoon/summer periods, while troughs occur in late winter.

Figure 1: Nepal’s Monthly Electricity Demand (2016-2025)
Annual Growth Analysis
Annual totals show steady expansion, with a brief stagnation in 2019/20 (0.36% YoY) likely due to COVID-19 disruptions, followed by a sharp rebound (13.6% in 2020/21). Peak months consistently shift to summer (e.g., July in recent years), reflecting irrigation and hydropower seasonality.
| Fiscal_Year | Total_Demand (GWh) | Avg_Monthly (GWh) | Peak_Month | Peak_Demand (GWh) | YoY_Growth (%) | CAGR (%) |
|---|---|---|---|---|---|---|
| 2016/17 | 7,064.51 | 588.71 | Jun | 647.70 | NA | 0.00 |
| 2017/18 | 7,408.57 | 617.38 | Jul | 733.06 | 4.87 | 4.87 |
| 2018/19 | 7,866.17 | 655.51 | Jun | 783.77 | 6.18 | 5.52 |
| 2019/20 | 7,894.17 | 657.85 | Sep | 826.14 | 0.36 | 3.77 |
| 2020/21 | 8,969.06 | 747.42 | Jul | 842.62 | 13.60 | 6.15 |
| 2021/22 | 10,686.17 | 890.51 | Jul | 1,110.24 | 19.10 | 8.63 |
| 2022/23 | 11,838.08 | 986.51 | Jul | 1,194.45 | 10.80 | 8.98 |
| 2023/24 | 12,700.98 | 1,058.42 | Jun | 1,336.49 | 7.29 | 8.74 |
| 2024/25 | 14,114.94 | 1,176.25 | Jul | 1,482.56 | 11.13 | 9.04 |
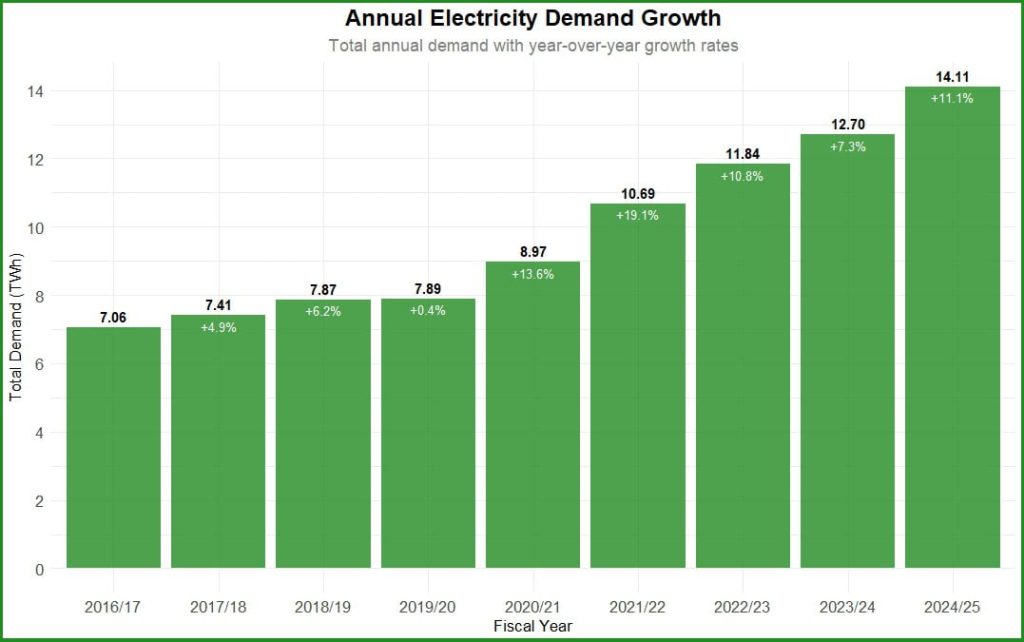
Figure 2: Annual Electricity Demand Growth
Seasonal Pattern Analysis
Averaged across years, demand peaks in July (973.45 GWh) and June (938.78 GWh) while December (703.12 GWh) and November (708.36 GWh) represent lows.
| Month | Avg_Demand (GWh) | SD_Demand (GWh) | Min_Demand (GWh) | Max_Demand (GWh) |
|---|---|---|---|---|
| Aug | 909.62 | 243.10 | 636.18 | 1,321.23 |
| Sep | 892.64 | 231.90 | 640.06 | 1,304.90 |
| Oct | 816.52 | 193.60 | 569.77 | 1,138.54 |
| Nov | 708.36 | 159.14 | 554.16 | 969.19 |
| Dec | 703.12 | 168.36 | 518.20 | 996.37 |
| Jan | 758.25 | 179.13 | 538.88 | 1,061.45 |
| Feb | 756.60 | 192.49 | 536.28 | 1,067.26 |
| Mar | 742.28 | 185.50 | 543.88 | 1,012.61 |
| Apr | 780.89 | 220.93 | 510.87 | 1,136.43 |
| May | 857.57 | 277.49 | 485.53 | 1,268.25 |
| Jun | 938.78 | 290.17 | 647.70 | 1,356.14 |
| Jul | 973.45 | 289.32 | 646.66 | 1,482.56 |

Figure 3: Seasonal Demand Patterns (2016-2025 Average)
Heatmap Visualization

Figure 4: Monthly Electricity Demand Heatmap
Monthly Growth Rate Distribution
YoY growth rates vary by month, with medians highest in April (15.2%) and May (18.4%). Overall median growth is 8.7%, with outliers in 2021/22.

Figure 5: Distribution of Year-over-Year Growth Rates by Month
Comparative Analysis Across Years

Figure 6: Monthly Demand Comparison Across Fiscal Years
Comprehensive Statistical Summary
1. Overall Statistics (2016-2025)
Total Period Demand: 88.54 TWh
Average Monthly Demand: 819.84 GWh
Minimum Monthly Demand: 485.53 GWh (May 2019/20)
Maximum Monthly Demand: 1,482.56 GWh (Jul 2024/25)
2. Compound Annual Growth Rate (CAGR)
Overall CAGR (2016/17-2024/25): 9.04%
3. Seasonal Insights
Highest demand months: Jul, Jun, Aug
Lowest demand months: Dec, Nov, Mar
4. Recent Trends (2024/25)
Average monthly demand: 1,176.25 GWh
Peak month: Jul (1,482.56 GWh)
Growth vs 2023/24: 11.13%
5. Volatility Analysis
Coefficient of Variation: 28.04%
Standard Deviation: 229.90 GWh
Forecasting
A seasonal ARIMA model (1,1,1)(0,1,1)[12] was fitted to the time series, capturing differenced trends and monthly cycles (AIC: 2,376.25; sigma²: 3.72e+09). The model forecasts 12 months ahead (through July 2026), projecting stabilization around 1,400-1,500 GWh with upper/lower confidence bands widening seasonally.

Figure 7: 12-Month Electricity Demand Forecast
Conclusion
Nepal’s electricity demand trajectory underscores a success story of energy access expansion. The compound annual growth rate (CAGR) stands at 9.04%, with year-over-year (YoY) fluctuations ranging from 0.36% to 19.1%. Seasonal patterns are pronounced, with peak demand in summer months (June, July, August) due to agricultural irrigation, cooling needs, and industrial activity, contrasting with lower winter demand (November, December, March).
Key insights include:
Overall Growth: Average monthly demand increased from 588.71 GWh to 1,176.25 GWh, with a coefficient of variation (CV) of 28.04% indicating moderate volatility.
Seasonal Peaks: July averages 973.45 GWh, while December averages 703.12 GWh.
Recent Trends: 2024/25 shows an 11.13% YoY increase over 2023/24, with July 2024/25 reaching a record 1,482.56 GWh.
Forecast: An ARIMA(1,1,1)(0,1,1)[12] model projects continued upward momentum, with 12-month forecasts averaging around 1,400-1,500 GWh per month.
More From Investopaper:
Comprehensive Analysis of Tourist Arrivals and Stay Patterns in Nepal (1964-2024)
A Study on Evolution and Growth of Banks & Financial Institutions in Nepal